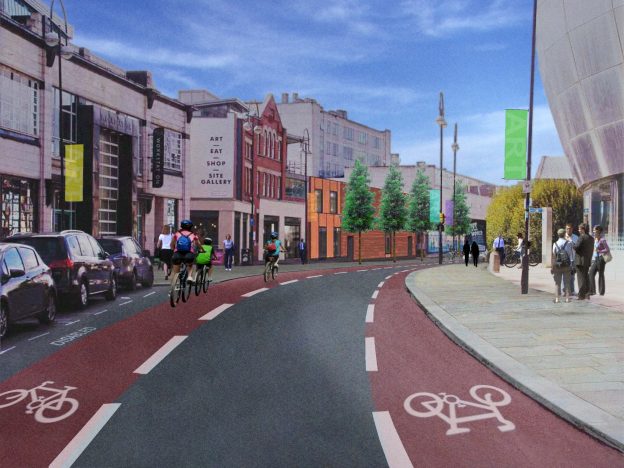
Sheffield Council are “consulting” on a major public realm redevelopment (Knowledge Gateway) in the City Centre, they’ve made it very difficult to respond by hiding the details of how to respond in a pdf, in a zip file, under the business section, of the local tourist information website.
This is how the council have advertised the ‘consultation’:
No way of participating is provided other than attending an exhibition.
Doesn’t include any drawings or detail.
Doesn’t link to any drawings or detail.
Doesn’t list a consultation closing date.
Provided a link to the Sheffield City Region website with the exact same information.
Hold an exhibition in the city centre during working hours and for 2 Saturday mornings
There will be public and trader consultations over the next few weeks. Exhibitions featuring the proposals will be held at Sheffield Hallam’s Sheffield Institute of Arts (the former head post office) café from Monday 13 February to Saturday 18 February 2017 (9am – 6pm, weekdays; 9am to 4PM) and then at the Site Gallery cafe, Paternoster Row from Tuesday 21 to Saturday 25 February 2017, (10am – 6pm weekdays; Saturday, 10am – 1pm.)
Yesterday the government announced the winners of the £60m Sustainable Travel Access Fund for 2017 to 2020. The fund details are here along with the criteria and application form.
Thousands more people will be encouraged to cycle and walk to work thanks to a £64 million government investment, Transport Minister Andrew Jones announced today (26 January 2017).
The funding will support local projects over 3 years from 2017 to 2020 and form part of a wider government package of more than £300 million to boost walking and cycling during the current parliament.
There were 28 winning authorities. I’ve collated links to each of the bids. 25 were awarded funding from the Sustainable Travel Access Fund, and 3 were awarded funding from the Cycling and Walking to Work fund. Where I’ve not been able to find the bid, I’ve submitted Freedom of Information requests which are also linked.
In this post I’m going to look at levels of cycling in Tonbridge.
I grew up in Tonbridge, moved to Sheffield when I was younger, and now I’m back in Tonbridge. Things in a small town of 40k people work a little differently to things in a city of half a million!
Of the approximately 17k people who travel to work each day (it’s that low, of the approx 40k people, 27k people are aged 16-74 and of those only about 20k are ‘economically active’).
Driving = 56% (9850 people), Car Passenger = 5%, Train = 20%, Walk = 14%, Bus = 2%, Cycling = 2% (365 people).
Some of the people who get the train to work will cycle to the train station and that isn’t included above, likewise for people driving to the train station.
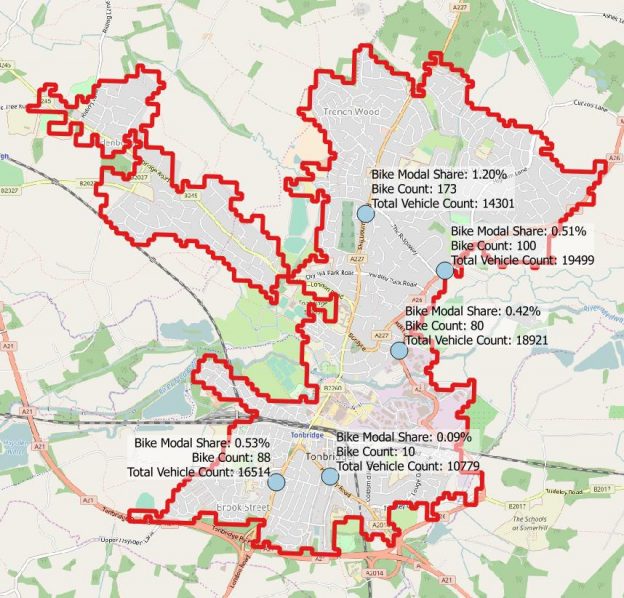
Across Tonbridge there isn’t much variation. There are no high pockets of people cycling to work.
Breaking it down by distance
For the 5,300 people (31%) who work within Tonbridge itself, the distribution of travel to work mode is:
Driving = 46% (2467 people), Car Passenger = 6%, Train = 1%, Walk = 36%, Bus = 3%, Cycling = 5% (260 people).
And in Tonbridge, 1897 people work very close to where they live (the same MSOA), the distribution of travel to work mode is:
Driving = 31% (590 people), Car Passenger = 3%, Train = 2%, Walk = 59%, Bus = 1%, Cycling = 4% (68 people).
To put this into perspective, Tonbridge is divided into 5 MSOA areas, most intra MSOA journeys will be less than 1km, but 31% of them are still driven and only 4% are cycled.
3 have a modal share of about 0.5%, 1 at 1.2% and 1 at 0.09%.
Tonbridge DfT Traffic Count Data for 2015
How often do people cycle?
The Active People Survey has data on cycling participation for Tonbridge and Malling Borough (which is significantly bigger than just Tonbridge).
It shows that in Tonbridge and Malling, only 2.9% of people cycle at least once per week for utility journeys, rising to 4.8% at least once per month.
Utility Cycling
Tonbridge and Malling
Kent
South East
At least once per month 2014/15
4.8%
3.8%
7.5%
At least once per week 2014/15
2.9%
2.4%
5.2%
At least three times per week 2014/15
2.1%
1.2%
2.8%
At least five times per week 2014/15
0.6%
0.6%
1.6%
All Cycling
Tonbridge and Malling
Kent
South East
At least once per month 2014/15
15.1%
13.5%
16.8%
At least once per week 2014/15
8.3%
7.9%
10.6%
At least three times per week 2014/15
3.8%
3.0%
4.9%
At least five times per week 2014/15
2.6%
1.8%
2.8%
Travel to School
Kent’s 2016 bid for the ‘Access Fund for Sustainable Travel’ included journey to school modal share. The data is from surveys that school fill in. It shows a 3.1% cycling modal share, which has been fairly constant from 2013 to 2016, about 40% by car, and just under 50% by foot.
In the next blog post, I’m going to take a look at the streets of Tonbridge and see how cycle friendly they are. With these cycling rates, the results probably won’t be surprising.
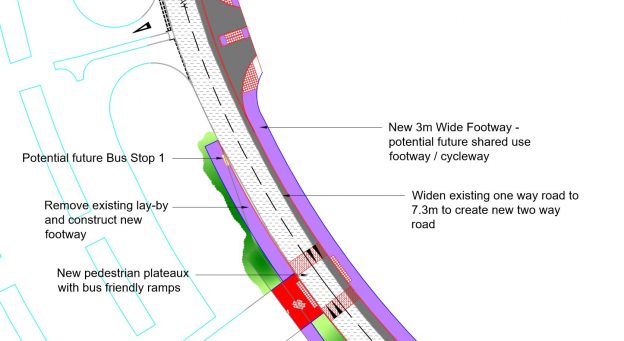
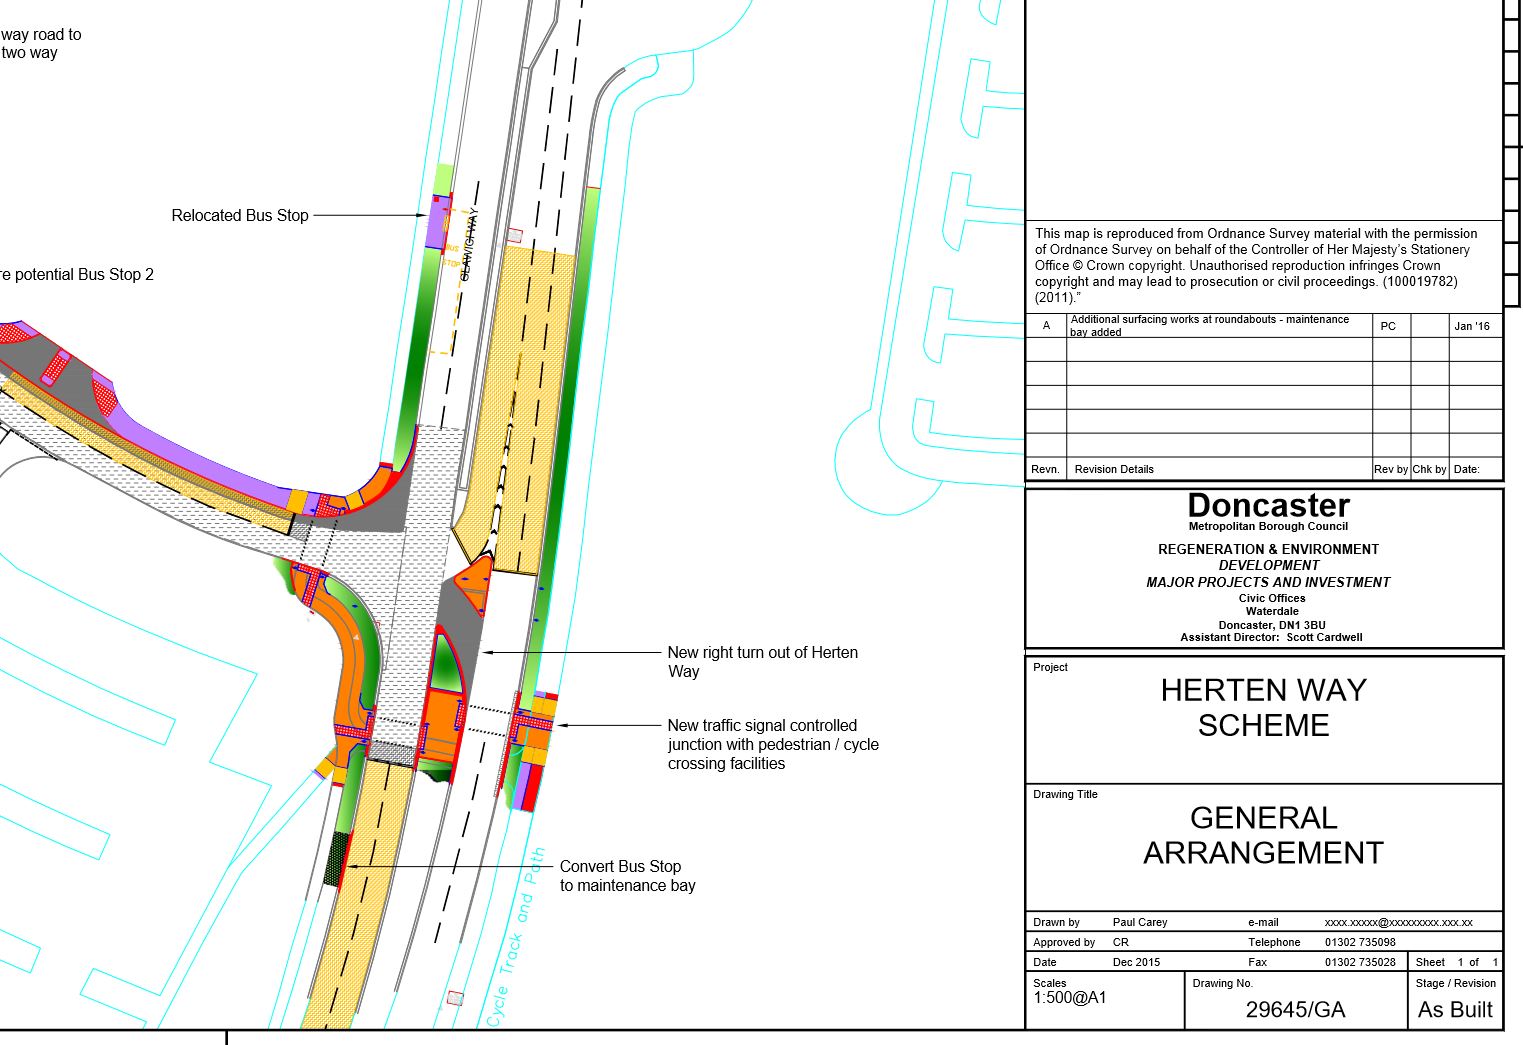
The proposed scheme will convert Herten Way into a two way road which will help to alleviate traffic congestion issues with ASDA in particular but also make an existing piece of development land more attractive for investment as access will be greatly improved.
The original design included an unsegregated shared use footway/cycleway, however even that was dropped from the design before the scheme was built. The shared use footway was the token sustainable transport part of this scheme, but even that minimal cycling facility was never built.
Following consultation with the Council’s cycling Transport Planners it has been decided that the length of footway along Herten Way will not be shared with cyclists at this time. Tactile provision will be amended accordingly. At such time as further development occurs in the area the cycling facilities will be reconsidered.
A new toucan crossing was built, at a cost of probably no more than £100,000 (guestimated), but the signals were required to facilitate the new turning movement at the junction because traffic is now 2 way, the junction was previously unsignalled.
Questions must be asked about the governance of the Sheffield City Region Sustainable Transport Exemplar Programme given some of the schemes that it is funding. This scheme cost £450,000 in total. Funds like these should go to creating well designed cycle infrastructure, not shared use pavements, not road widening, and not converting 1 way roads to 2 way at an out of town retail park.
The road safety audit provides a good insight into how the scheme has been designed.
The raised plateaux is intended as an aid to pedestrians crossing the carriageway rather than a traffic calming feature such as a road hump. As such the approach and exit ramps will be installed with a shallow gradient <1:20. The ramp areas will also be treated with red coloured surfacing and a set of warning triangles which the Designers feels would be sufficient warning to approaching drivers and would highlight the presence of pedestrians.
How do you effectively persuade people to choose a more sustainable mode of transportation?
Is it by telling them what do to? Or are their choices influenced by our streets, our public spaces and bigger structural issues?
When we live in a country designed around the car, are people really free to make their own choices?
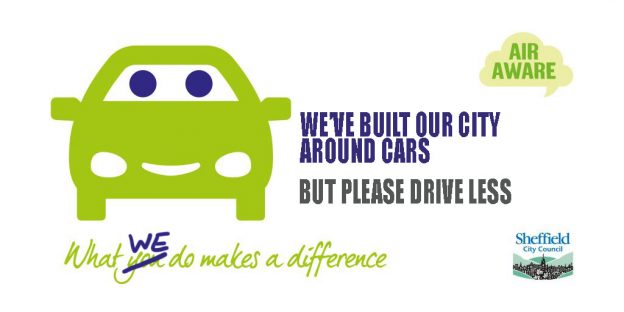
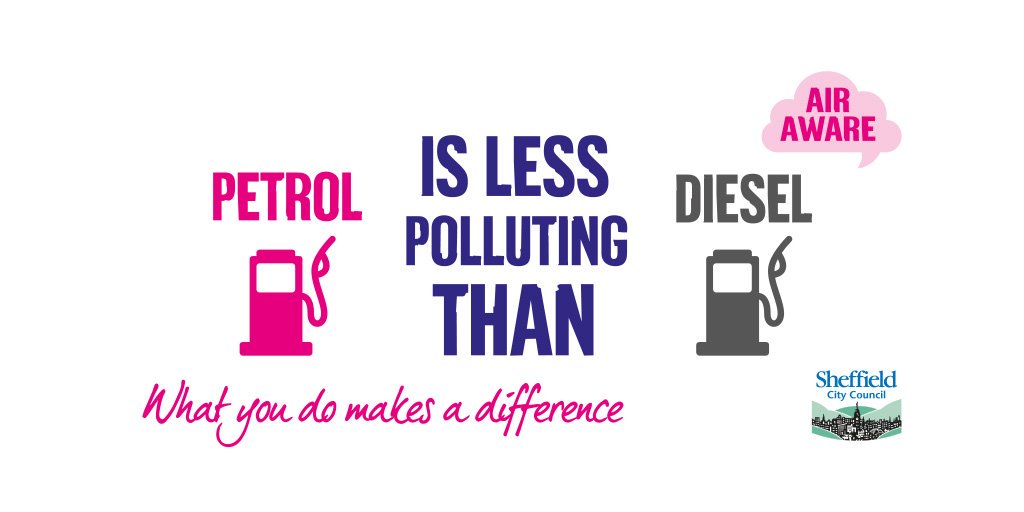
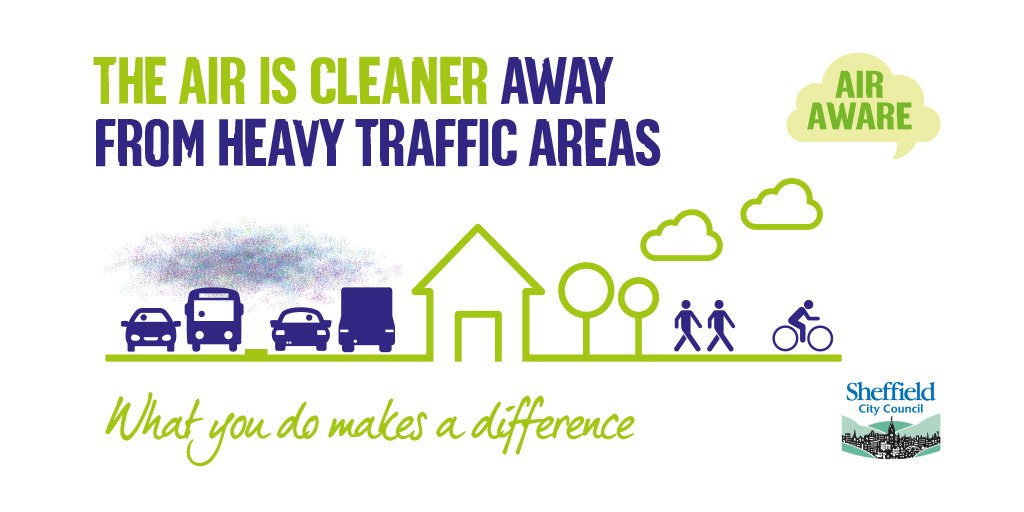
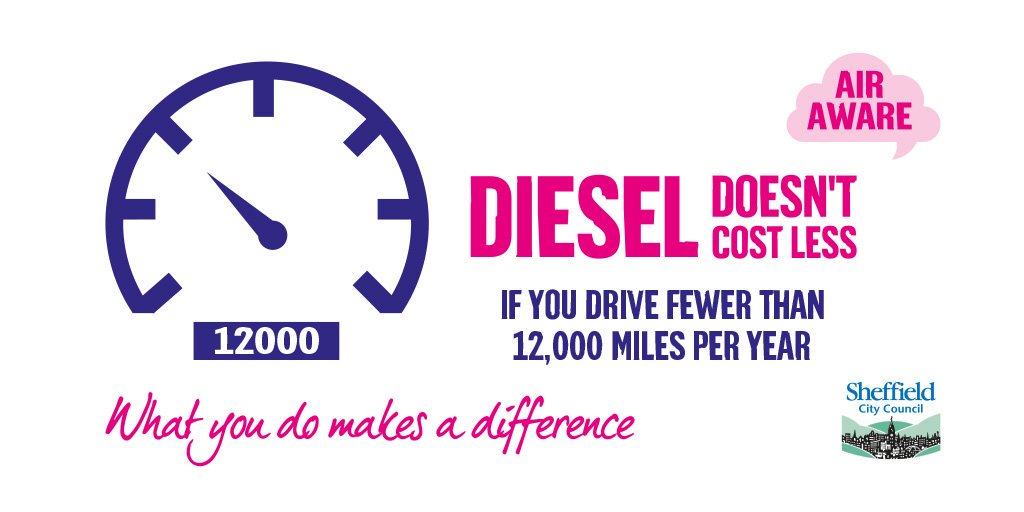
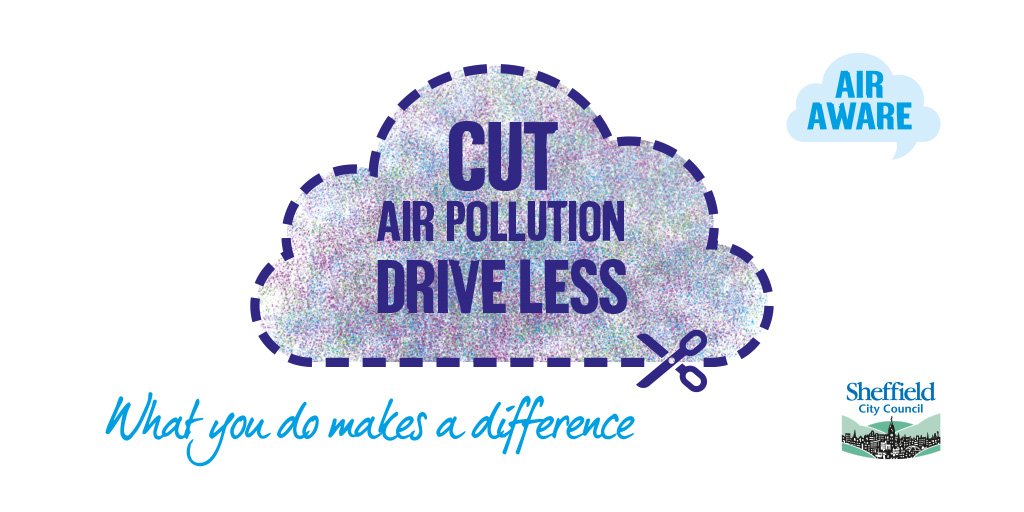
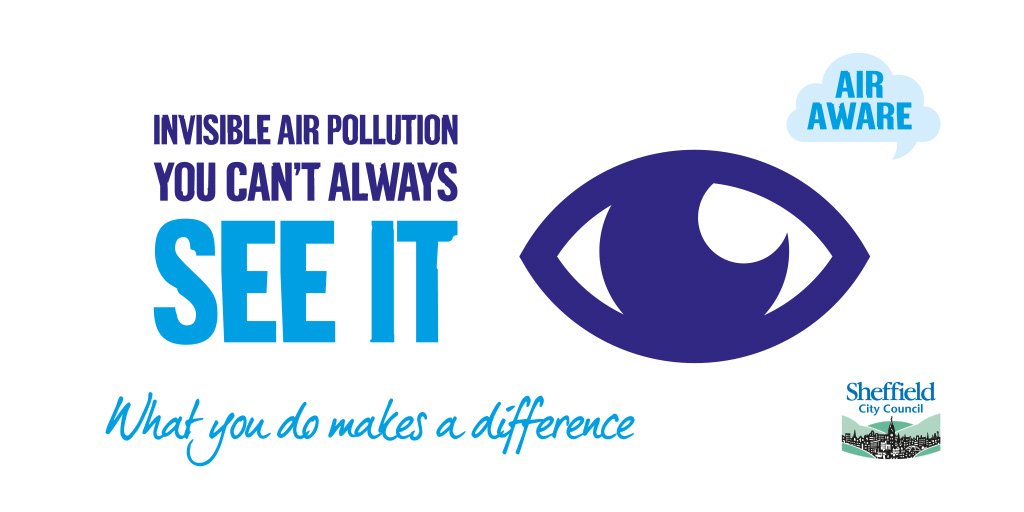
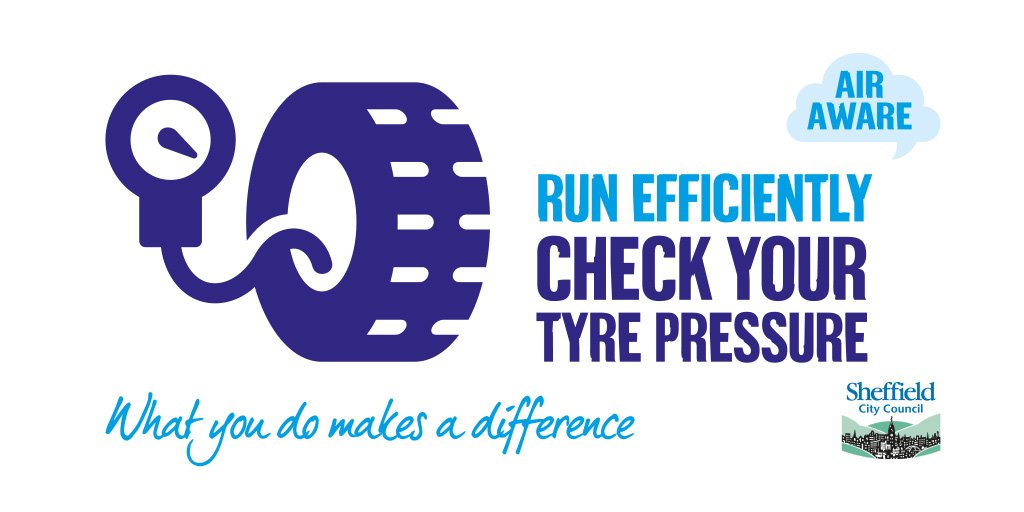
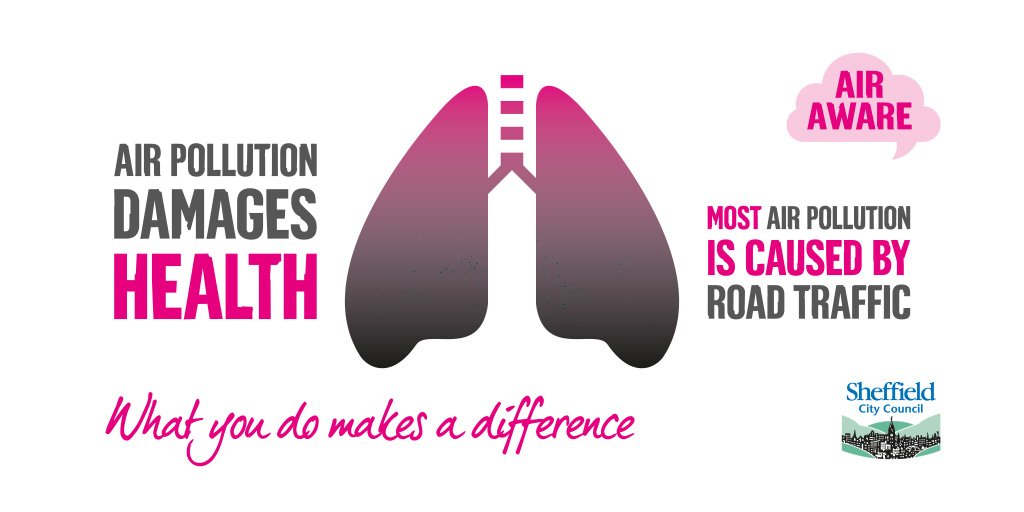
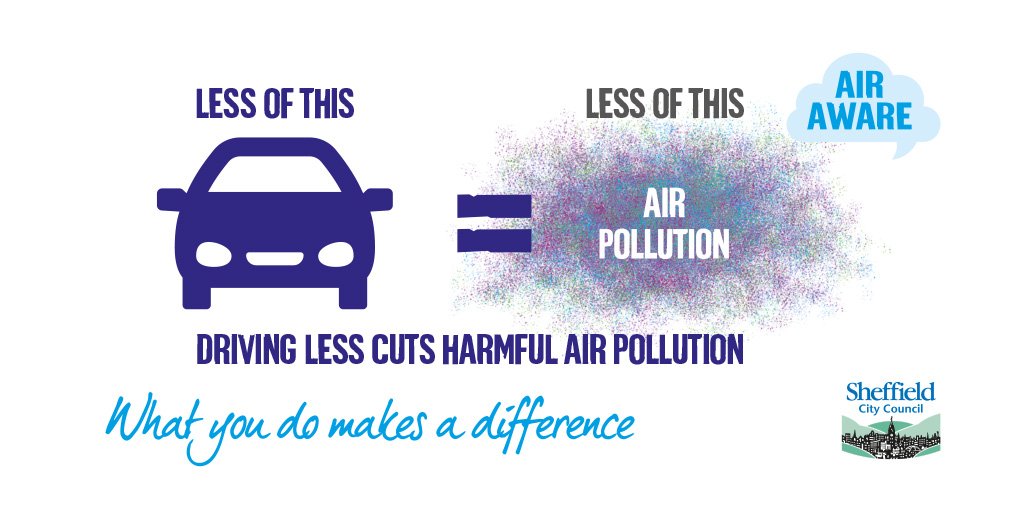
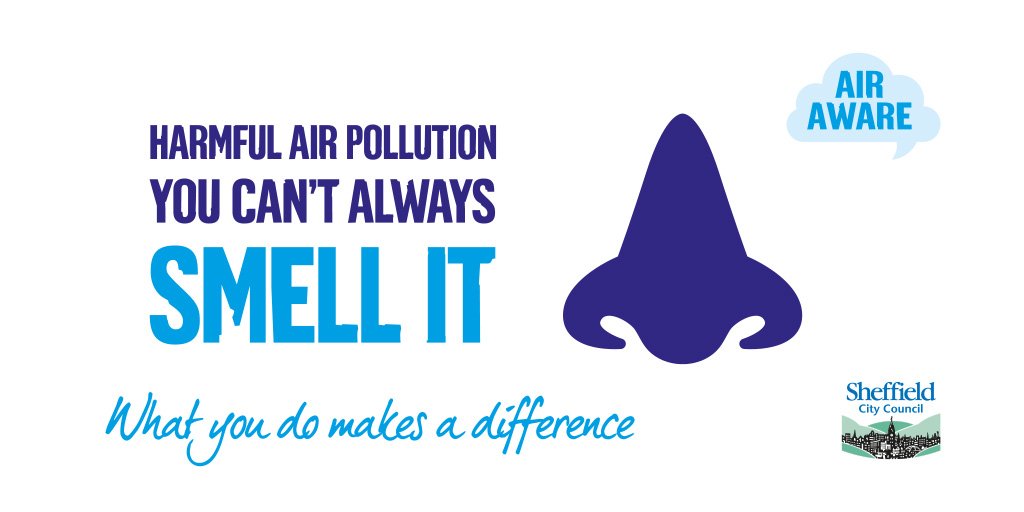
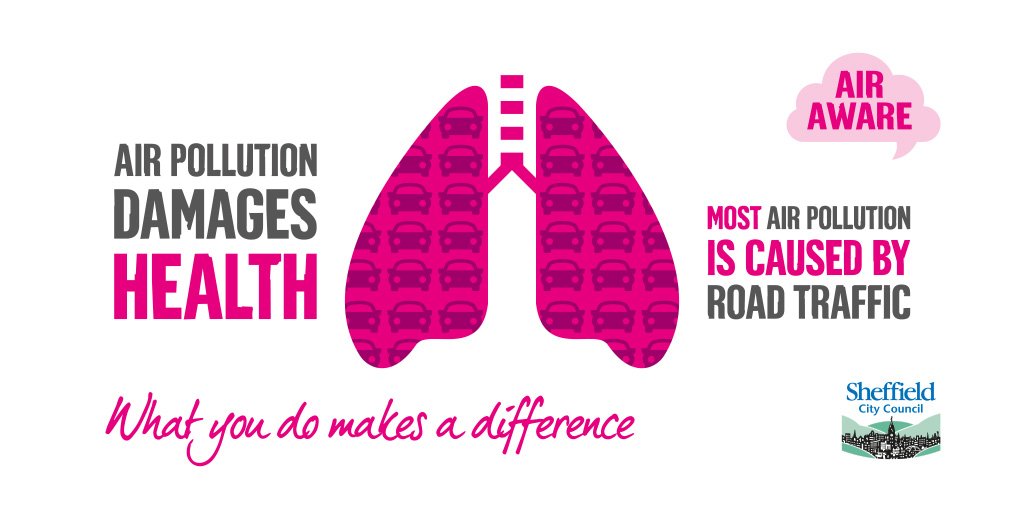
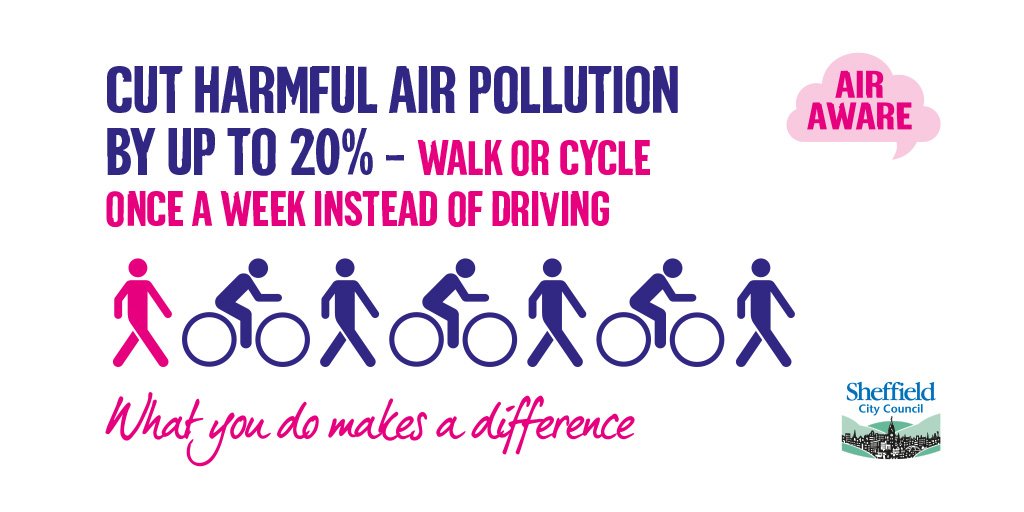
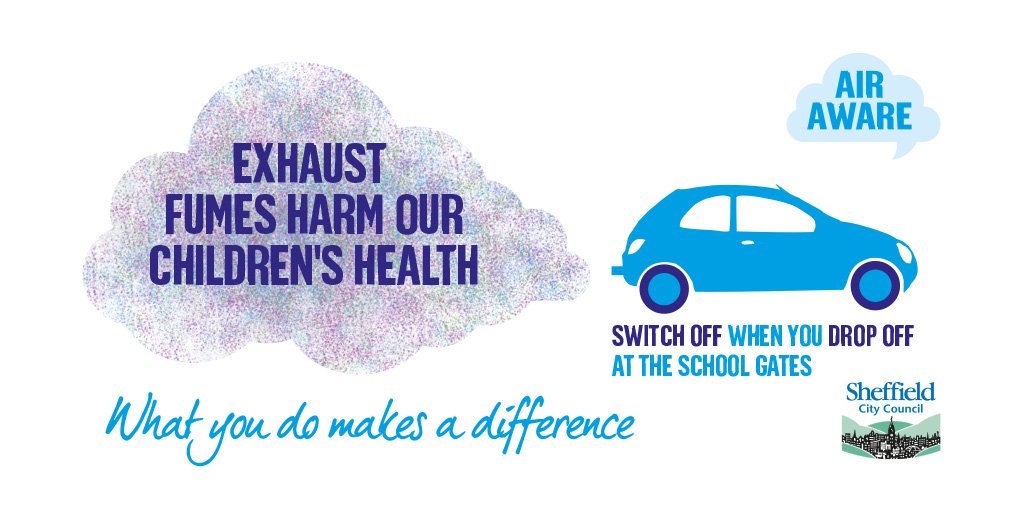
For the past few months Sheffield Council has been running a campaign under the title ‘Air Aware, What You Do Makes a Difference’ (Twitter, Website).
We want to help make everyone in Sheffield more air aware so that you can make choices which help to protect you and your loved ones.
I think that what the council do makes a much bigger difference, the council needs to be more air aware so that their choices help protect the people of Sheffield.
Putting the emphasis on changing individual behaviours through a campaign like this is a distraction and a waste of time. This is why I’ve created a series of new images with the strap line ‘What we do makes a difference’, we being Sheffield Council.
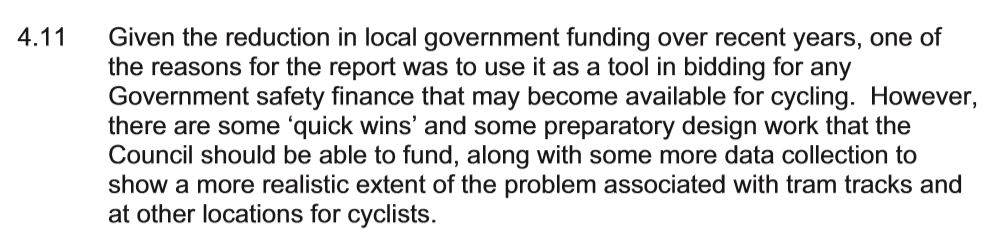
The latest Sheffield Council report into the dangers caused to cyclists by the city’s tram lines has been a long time coming. Commissioned in July 2014, issued to the council in Sept 2015, and published in June 2016. After almost 2 years of work, the report should be impressive, but sadly it’s deeply disappointing and its severely lacking in a number of key areas outlined below. You can read the full report here.
Converting footways to ‘shared use’: lumping people cycling in with people walking to the frustration of all
Suggested road layout changes focus on converting existing footways to ‘shared use’, with a presumption that cycling space must come from existing (limited) pedestrian space. Reallocation of space away from motor traffic is not given a single thought, and the creation of dedicated cycle ways is noticeable in its absence.
“…where footway width and pedestrian activity precluded almost any physical changes to the road and footway layouts”“…space limitation in the highway, narrow footways near the tramway and significant levels of pedestrian activity in various locations mean that opportunities that some other tramways (especially in Holland, USA and Canada) have been able to utilise are not readily available on most of the Supertram network.”Constraints do not include motor traffic, it never crossed their minds to change the space allocated to motor traffic.
None of the provisional layout changes create cycleways, they just lump cycling in with walking, on the footway. It is a cycling report inspired by LTN2/08, widely considered to be obsolete and far behind recognised best practice in designing for walking and cycling.
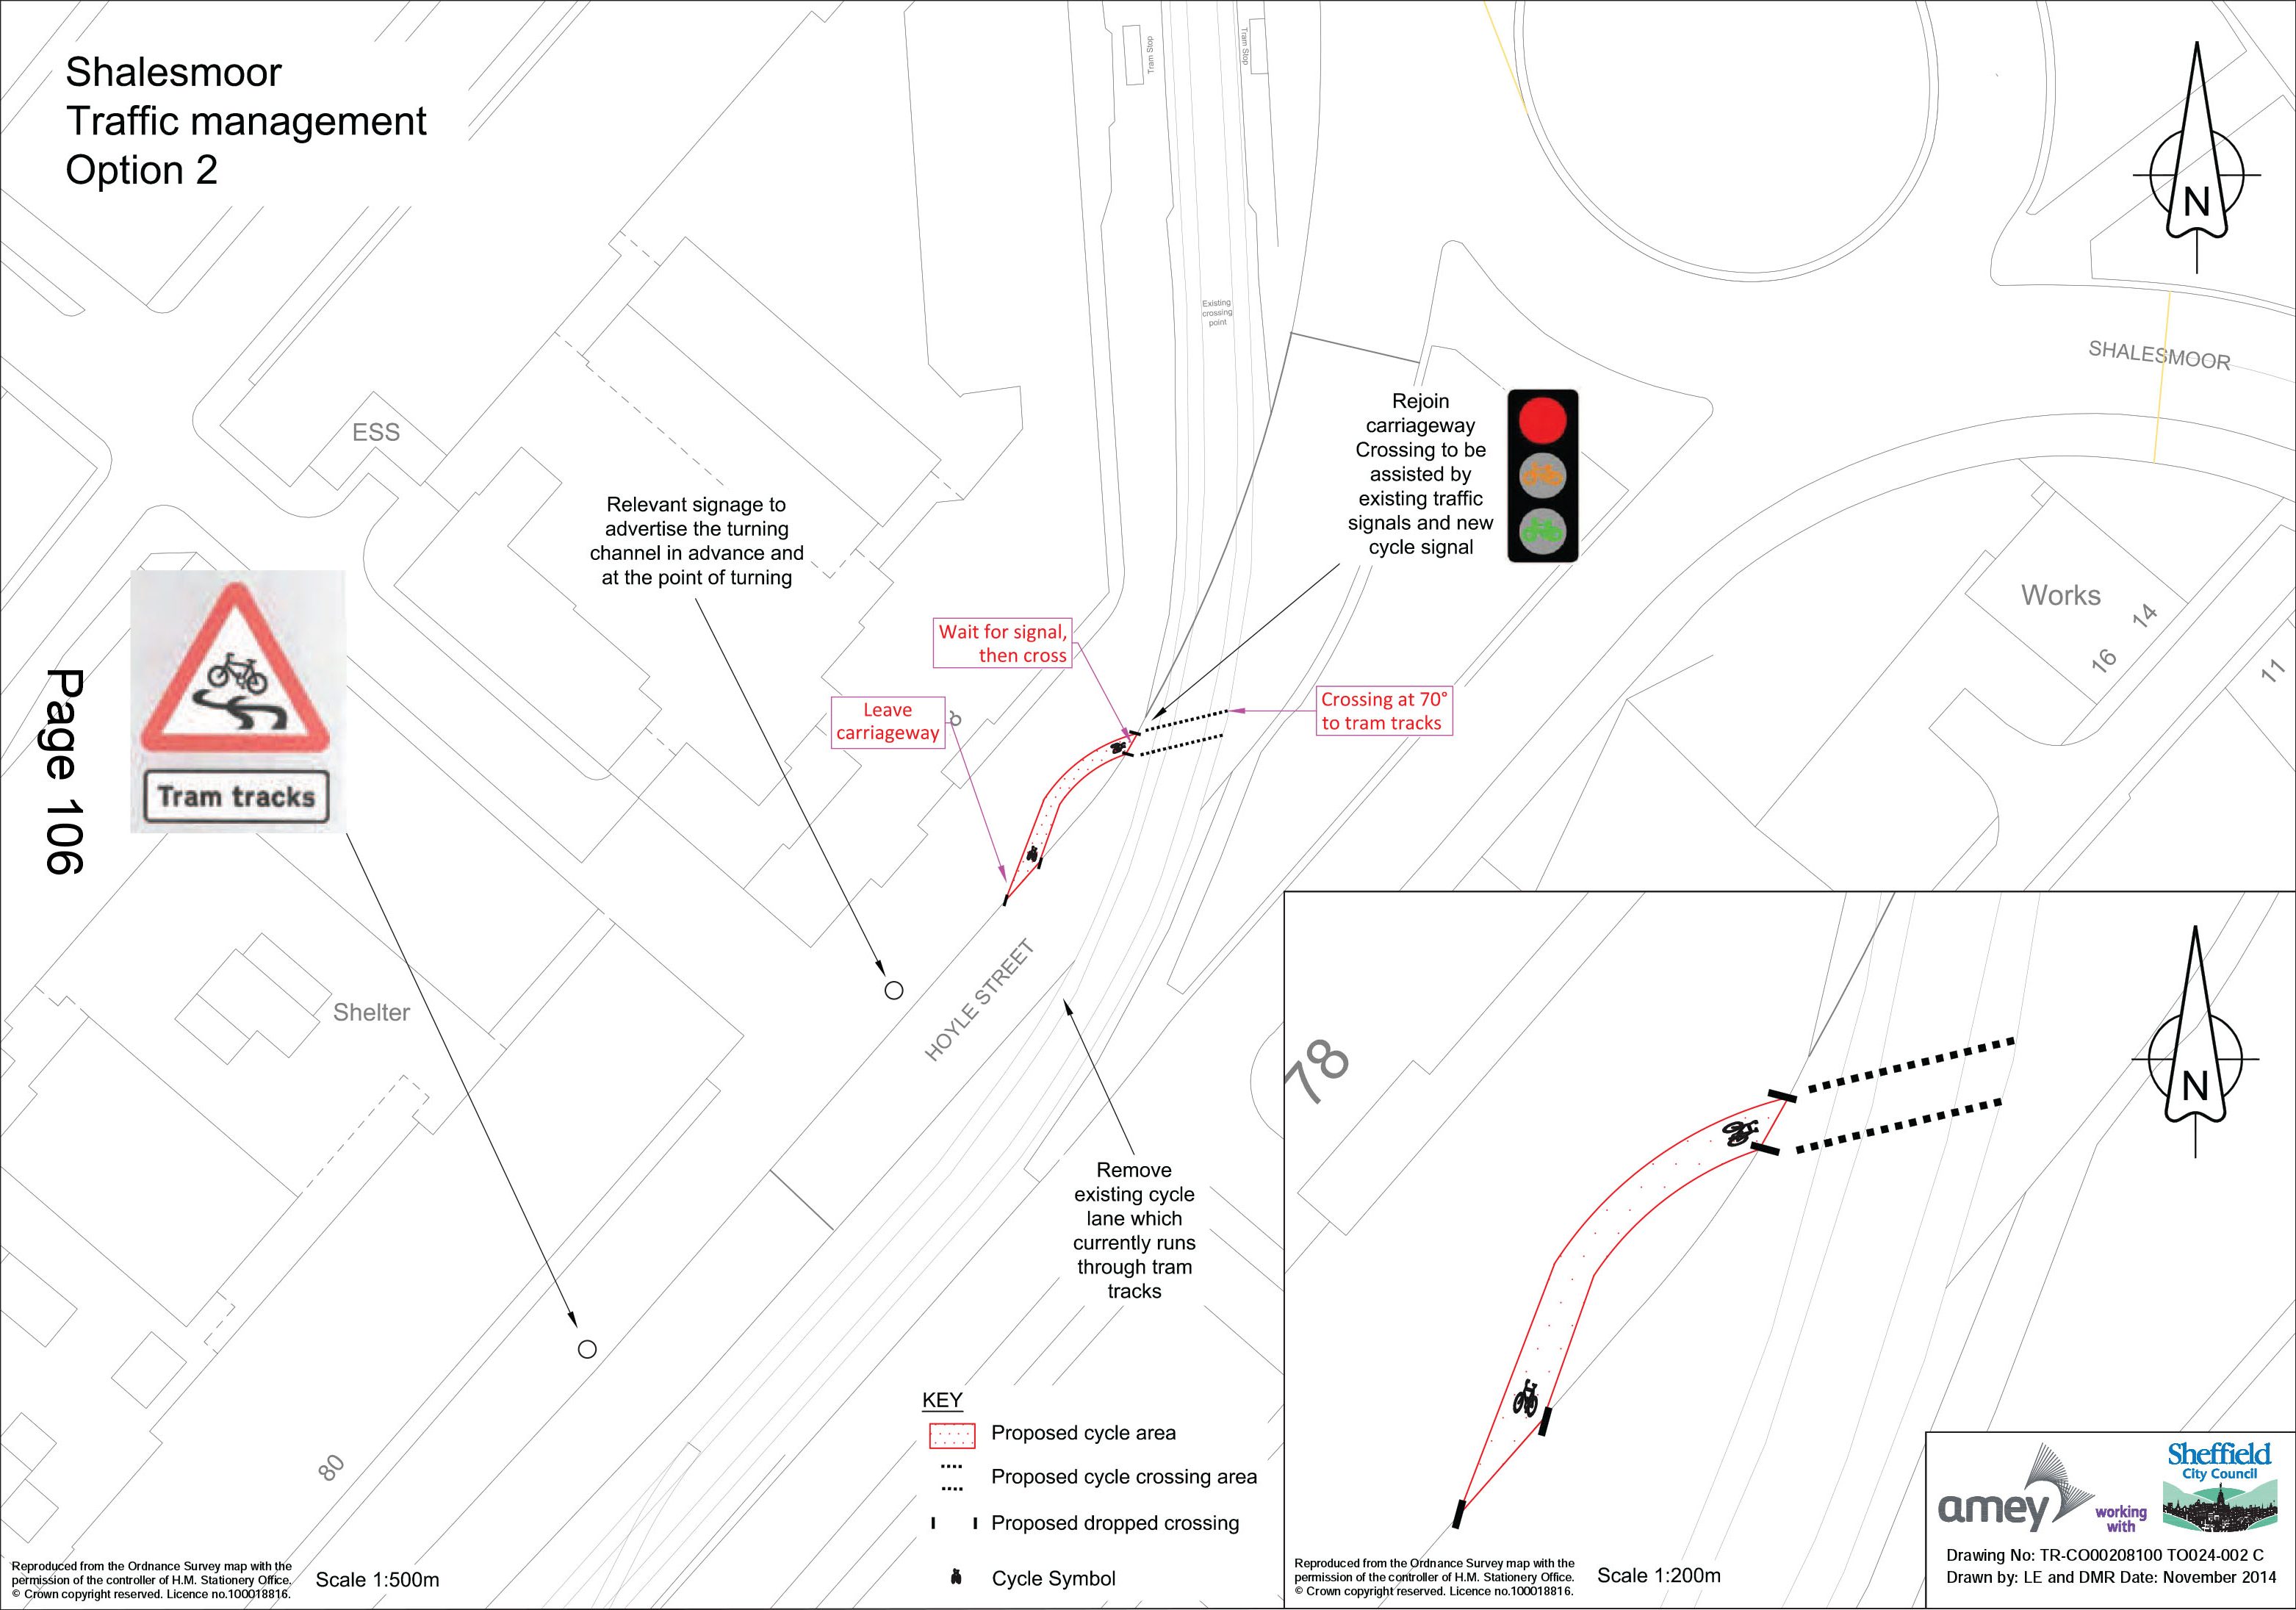
Shalesmoor Traffic Management Option 1
Shalesmoor Traffic Management Option 2
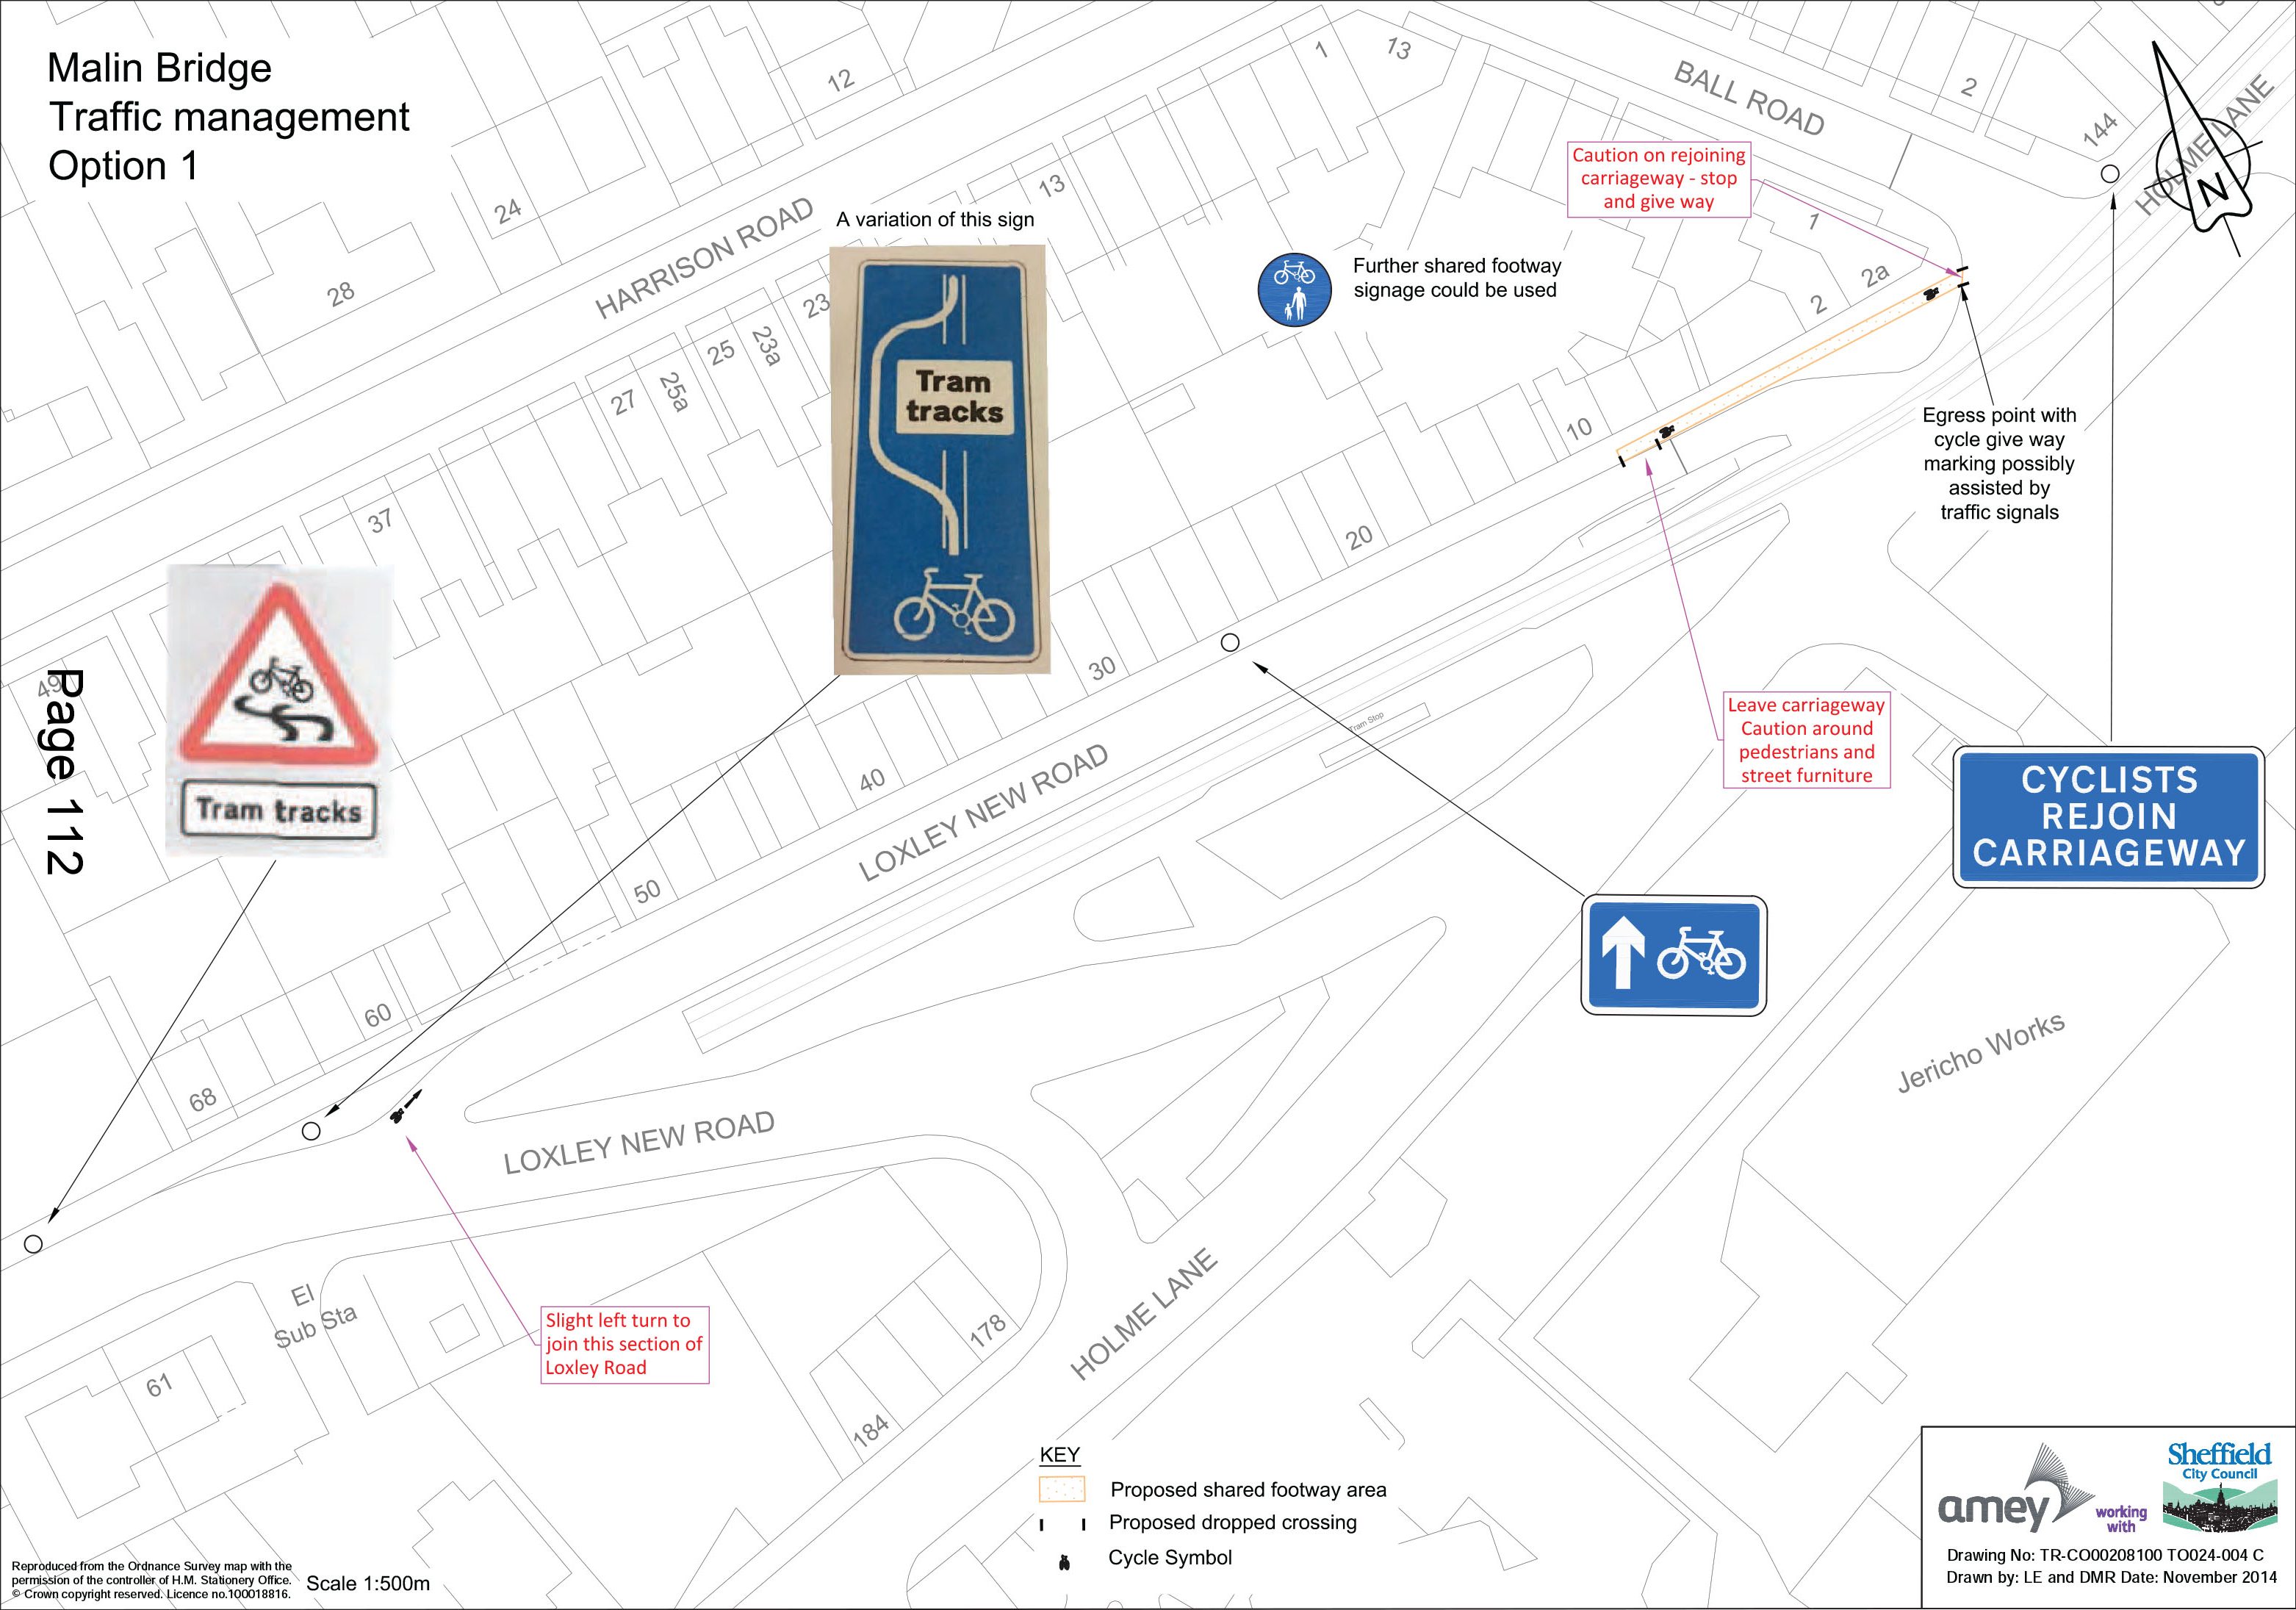
Malin Bridge Traffic Management Option 1
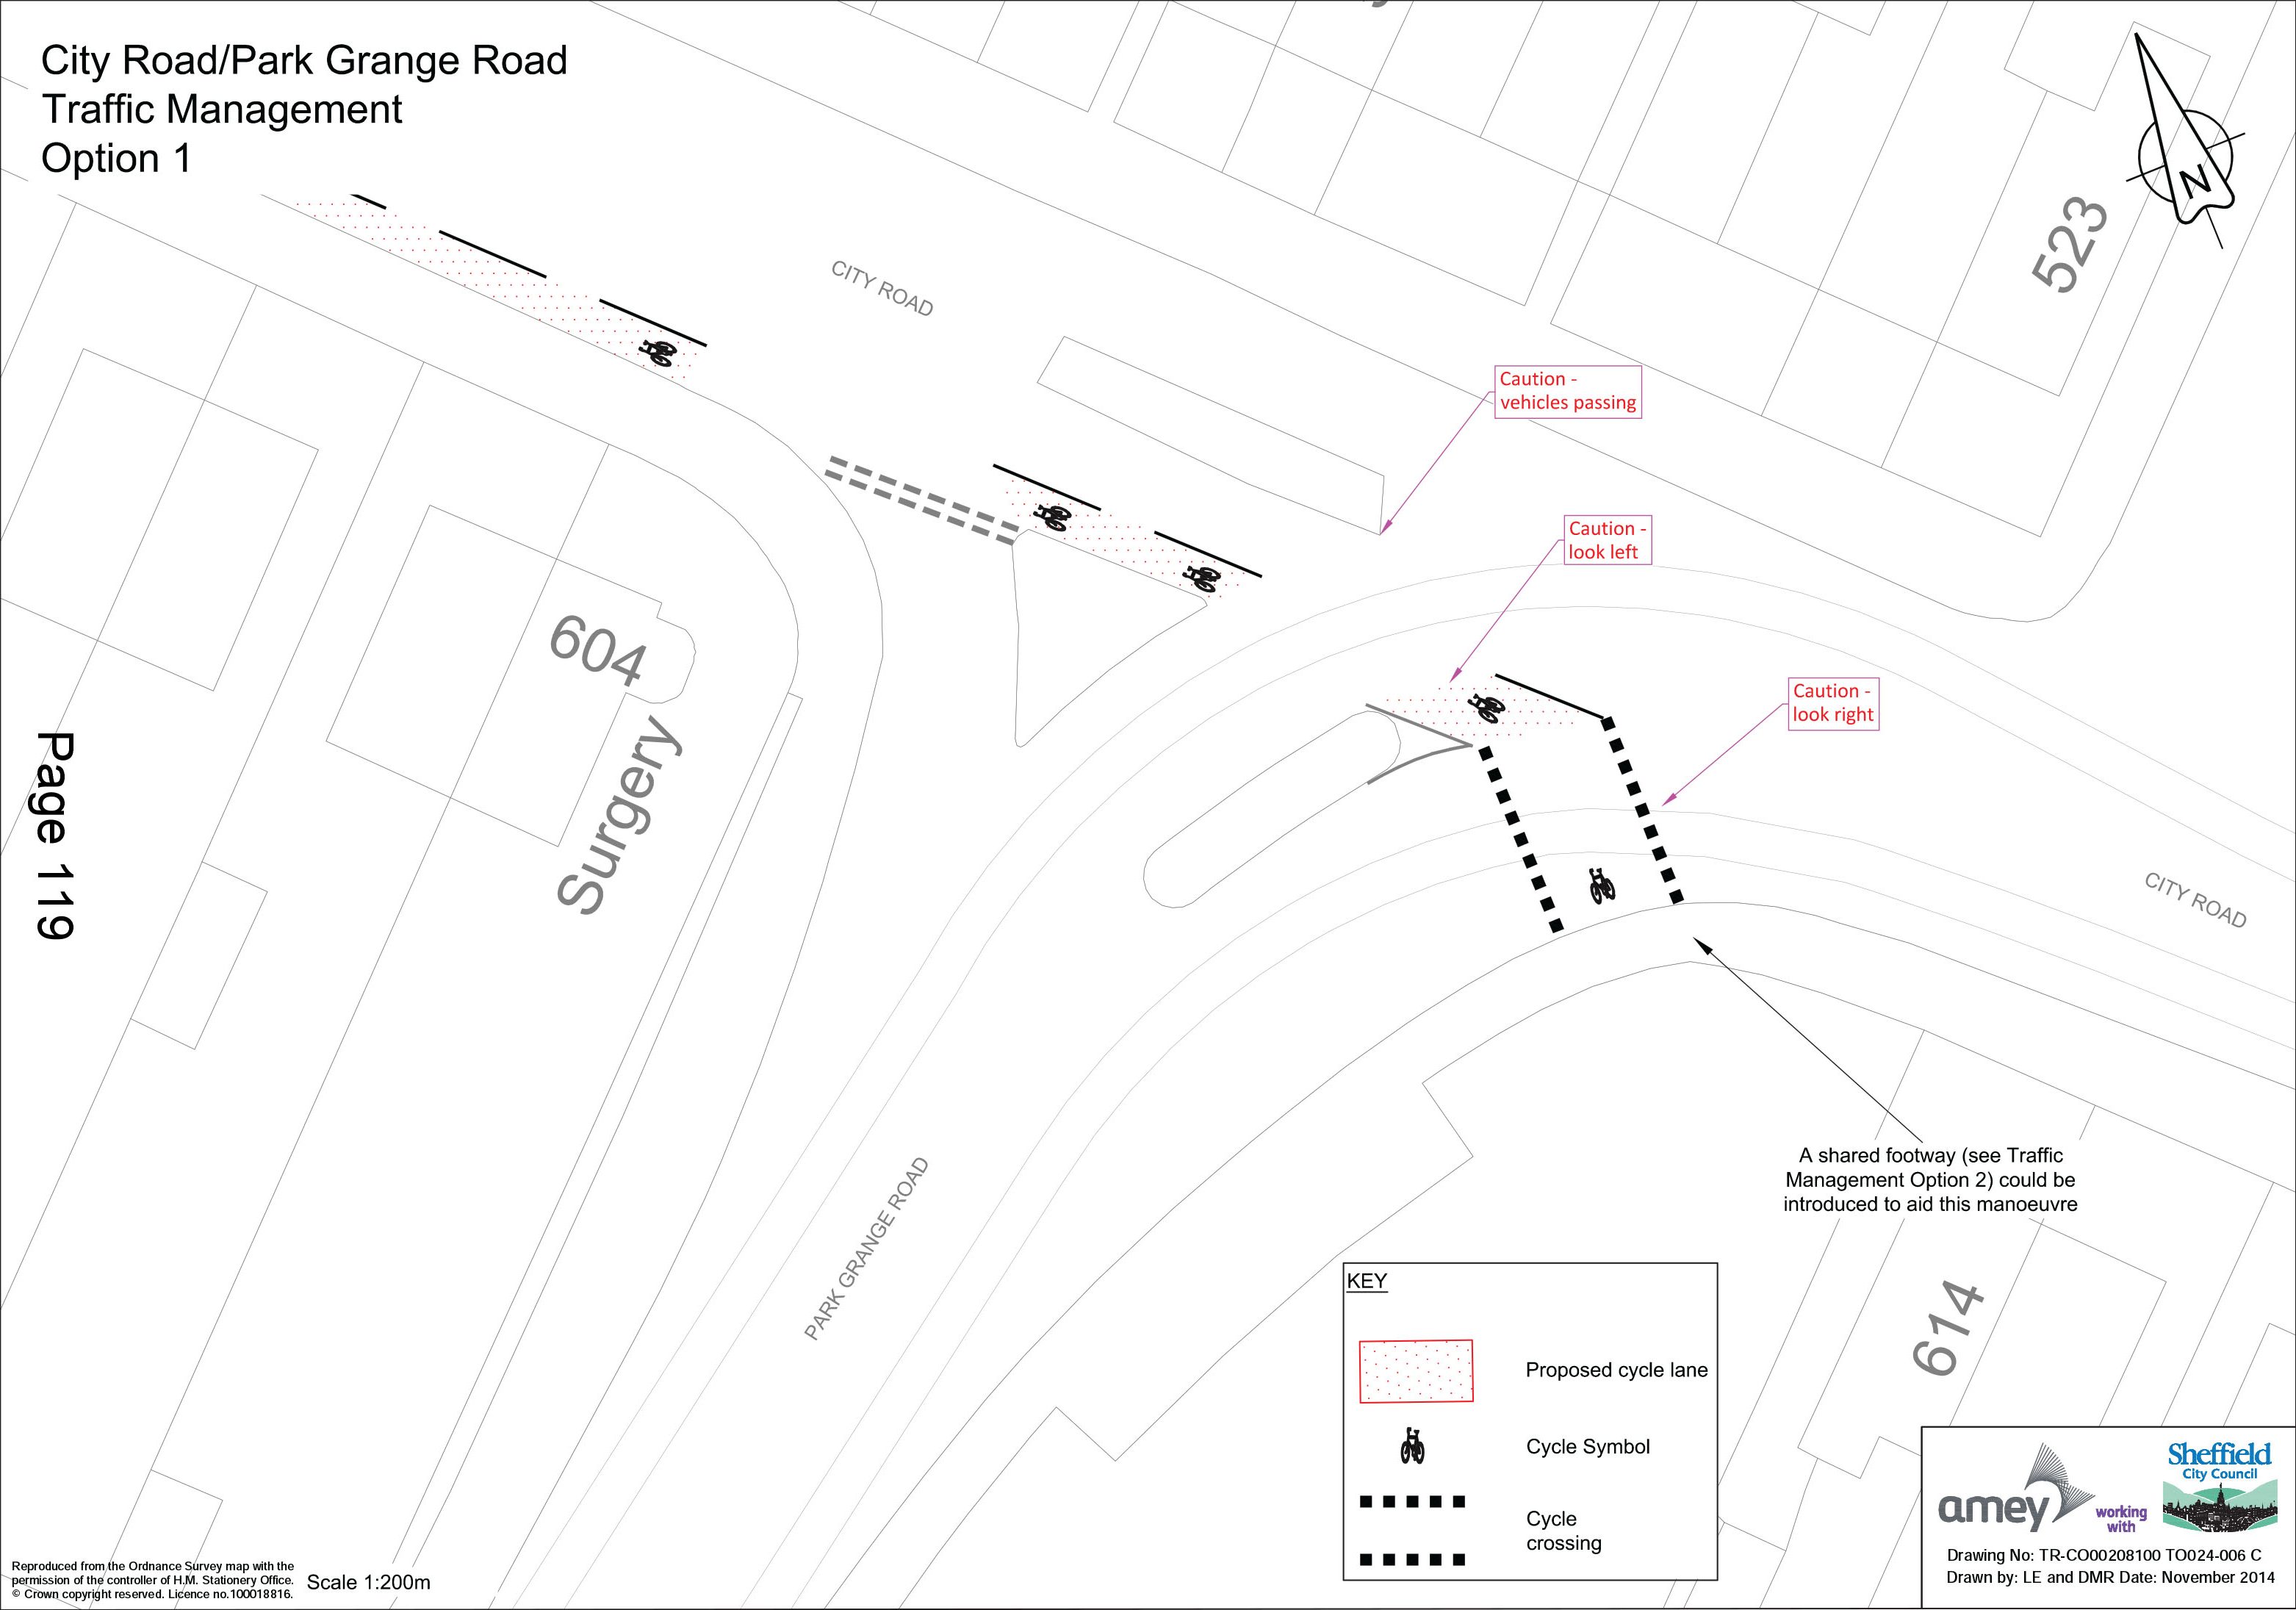
City Road/Park Grange Road Traffic Management Option 1
City Road/Park Grange Road Traffic Management Option 2
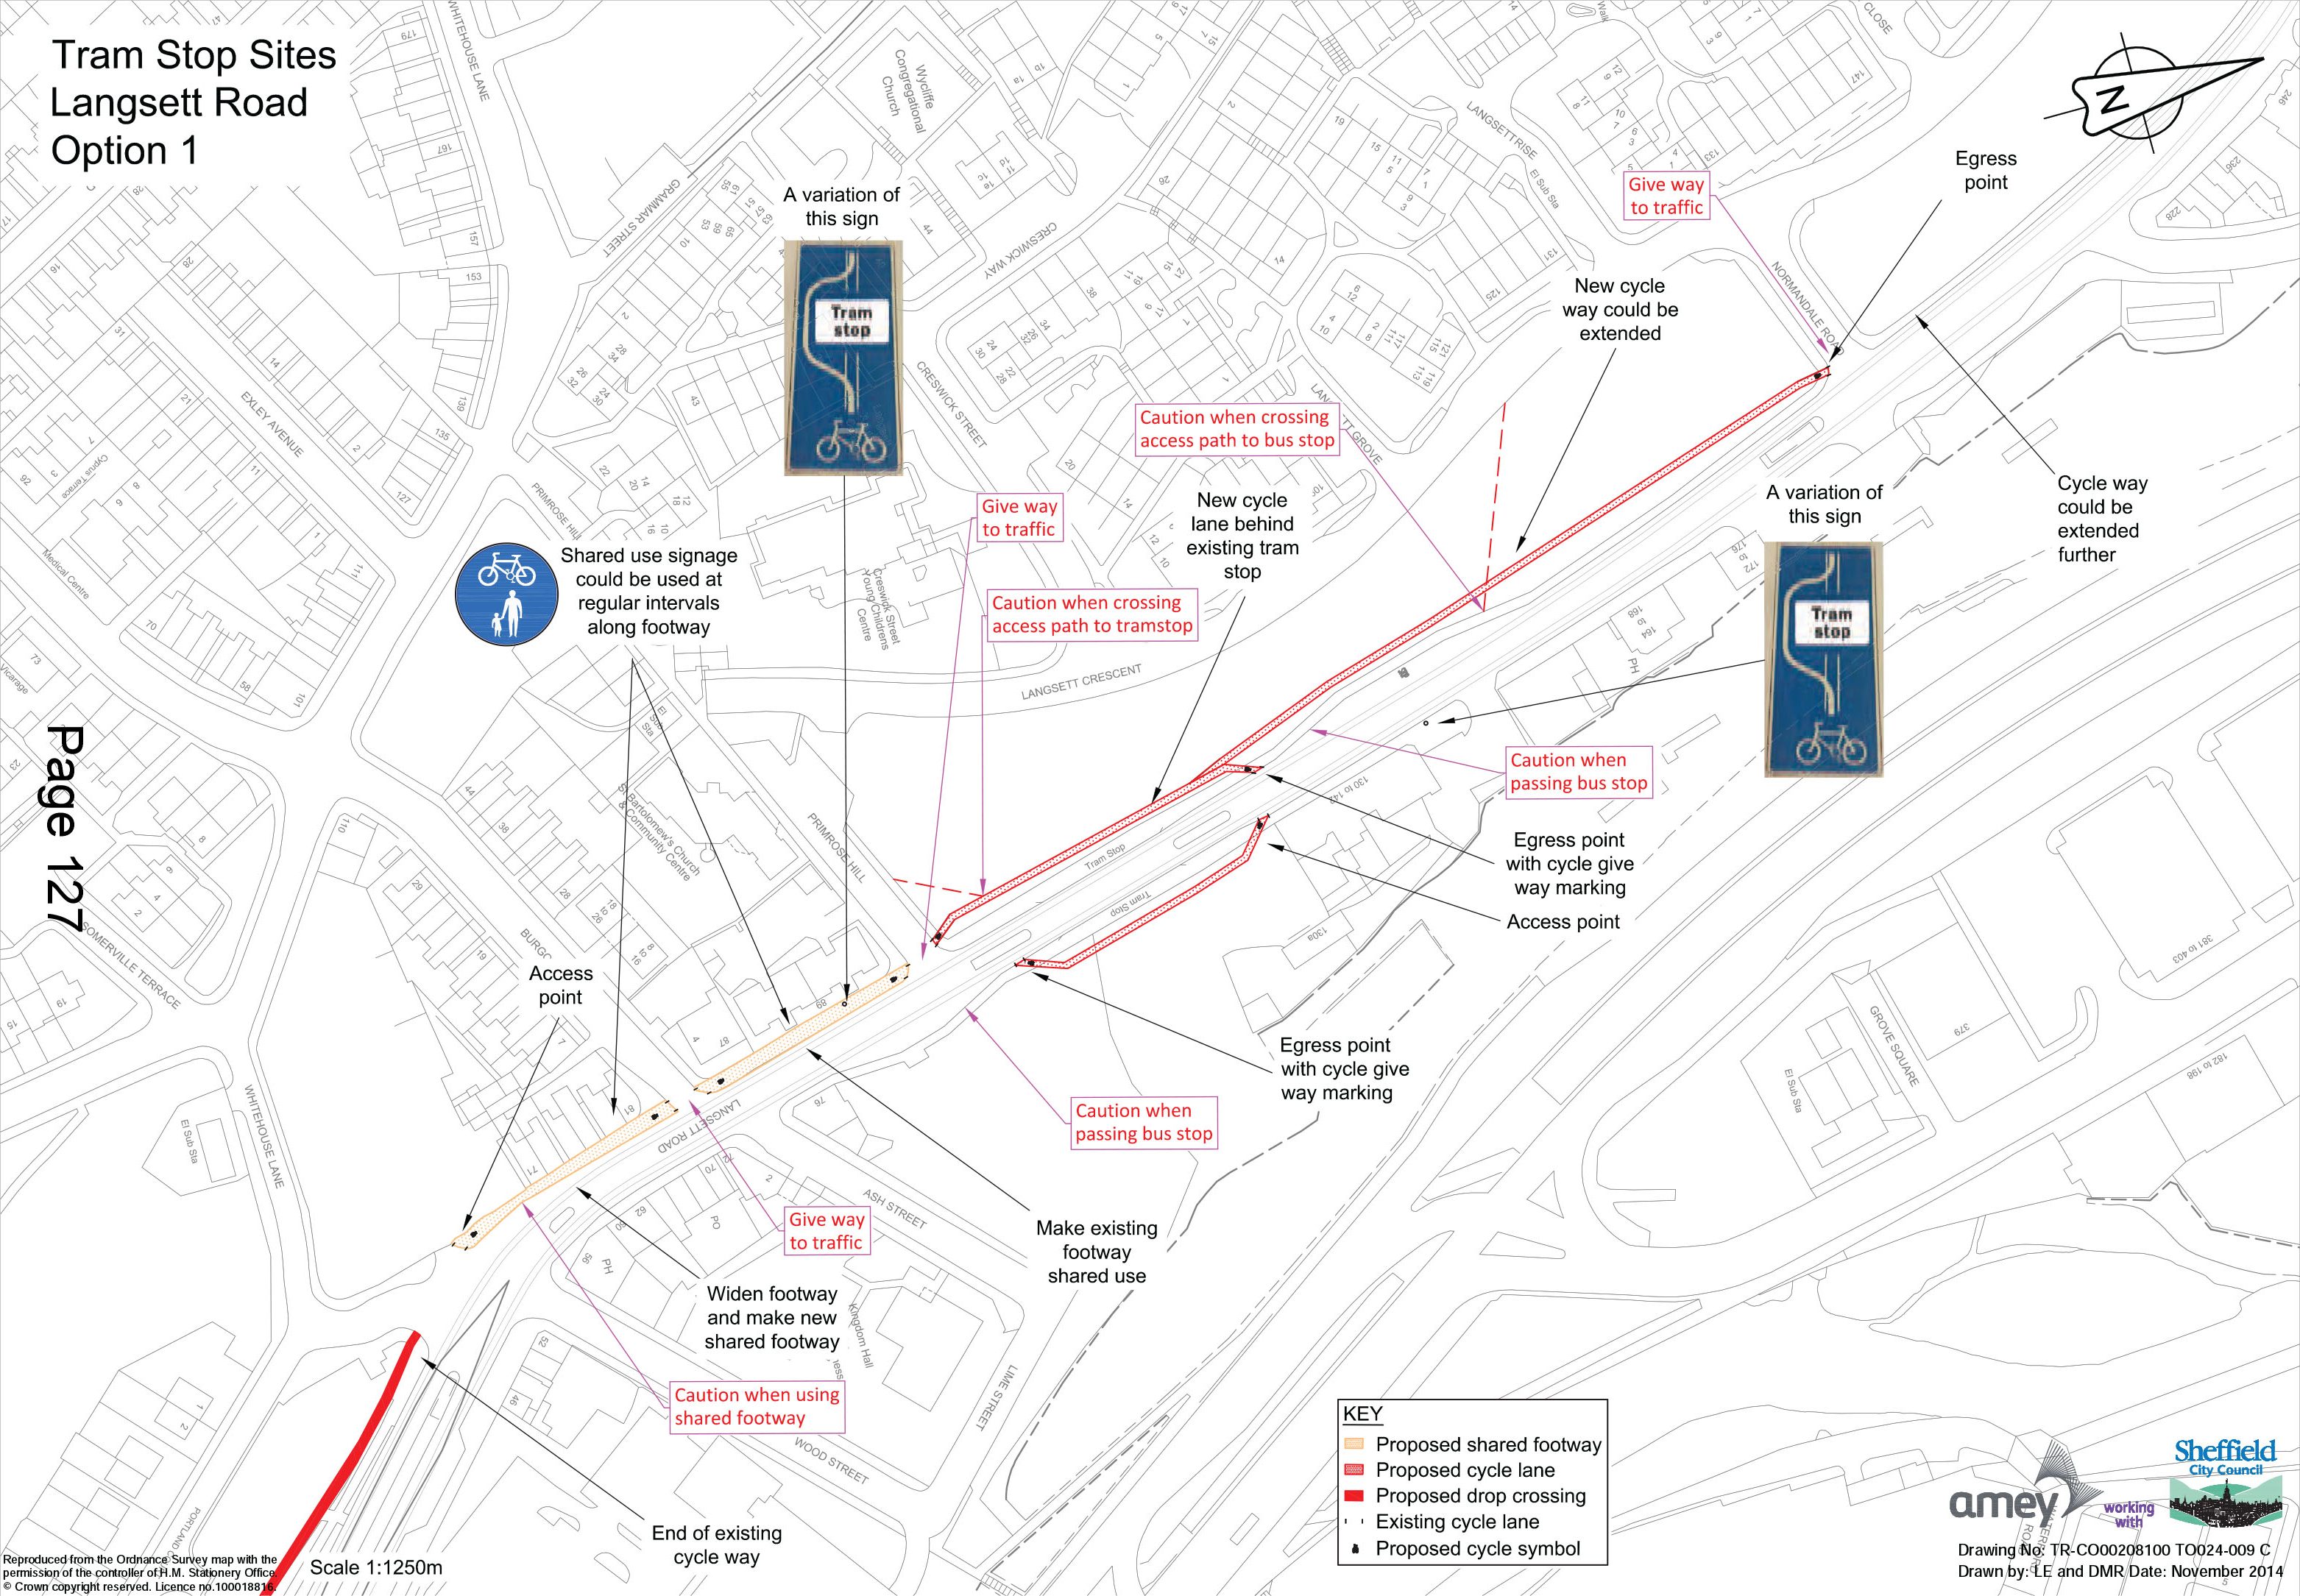
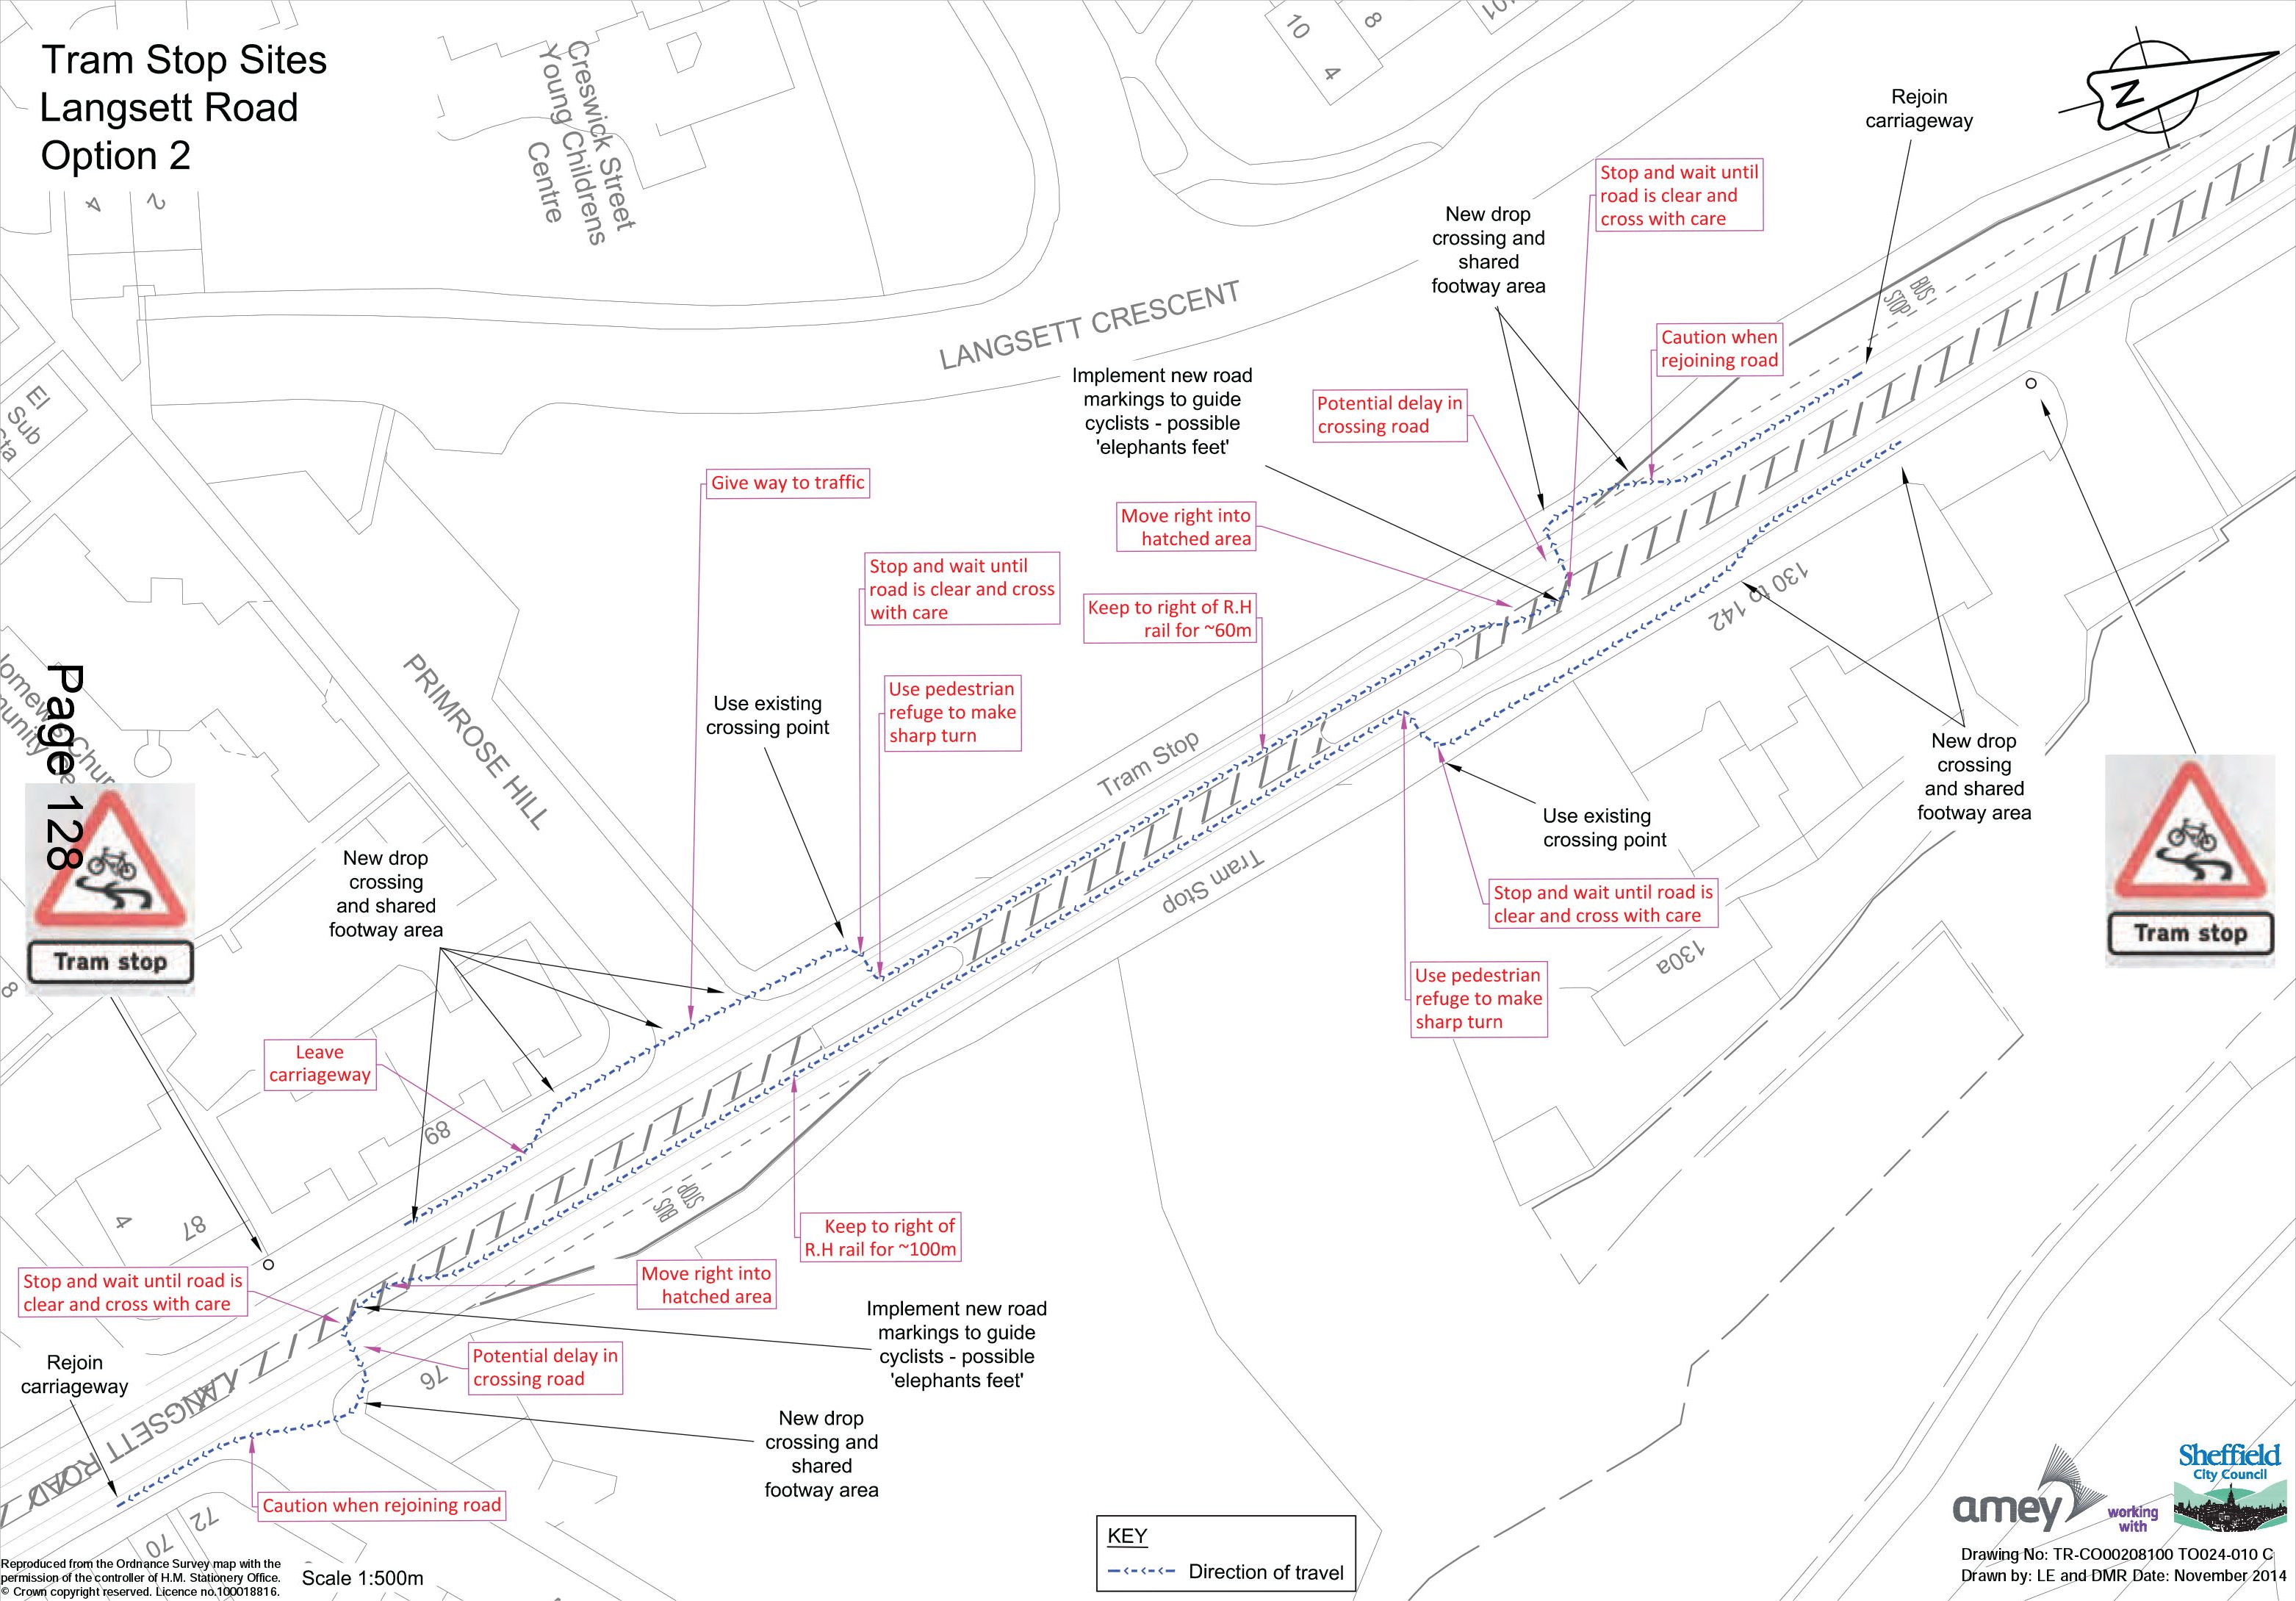
Tram Stop Sites Langsett Road Option 1
Tram Stop Sites Langsett Road Option 2
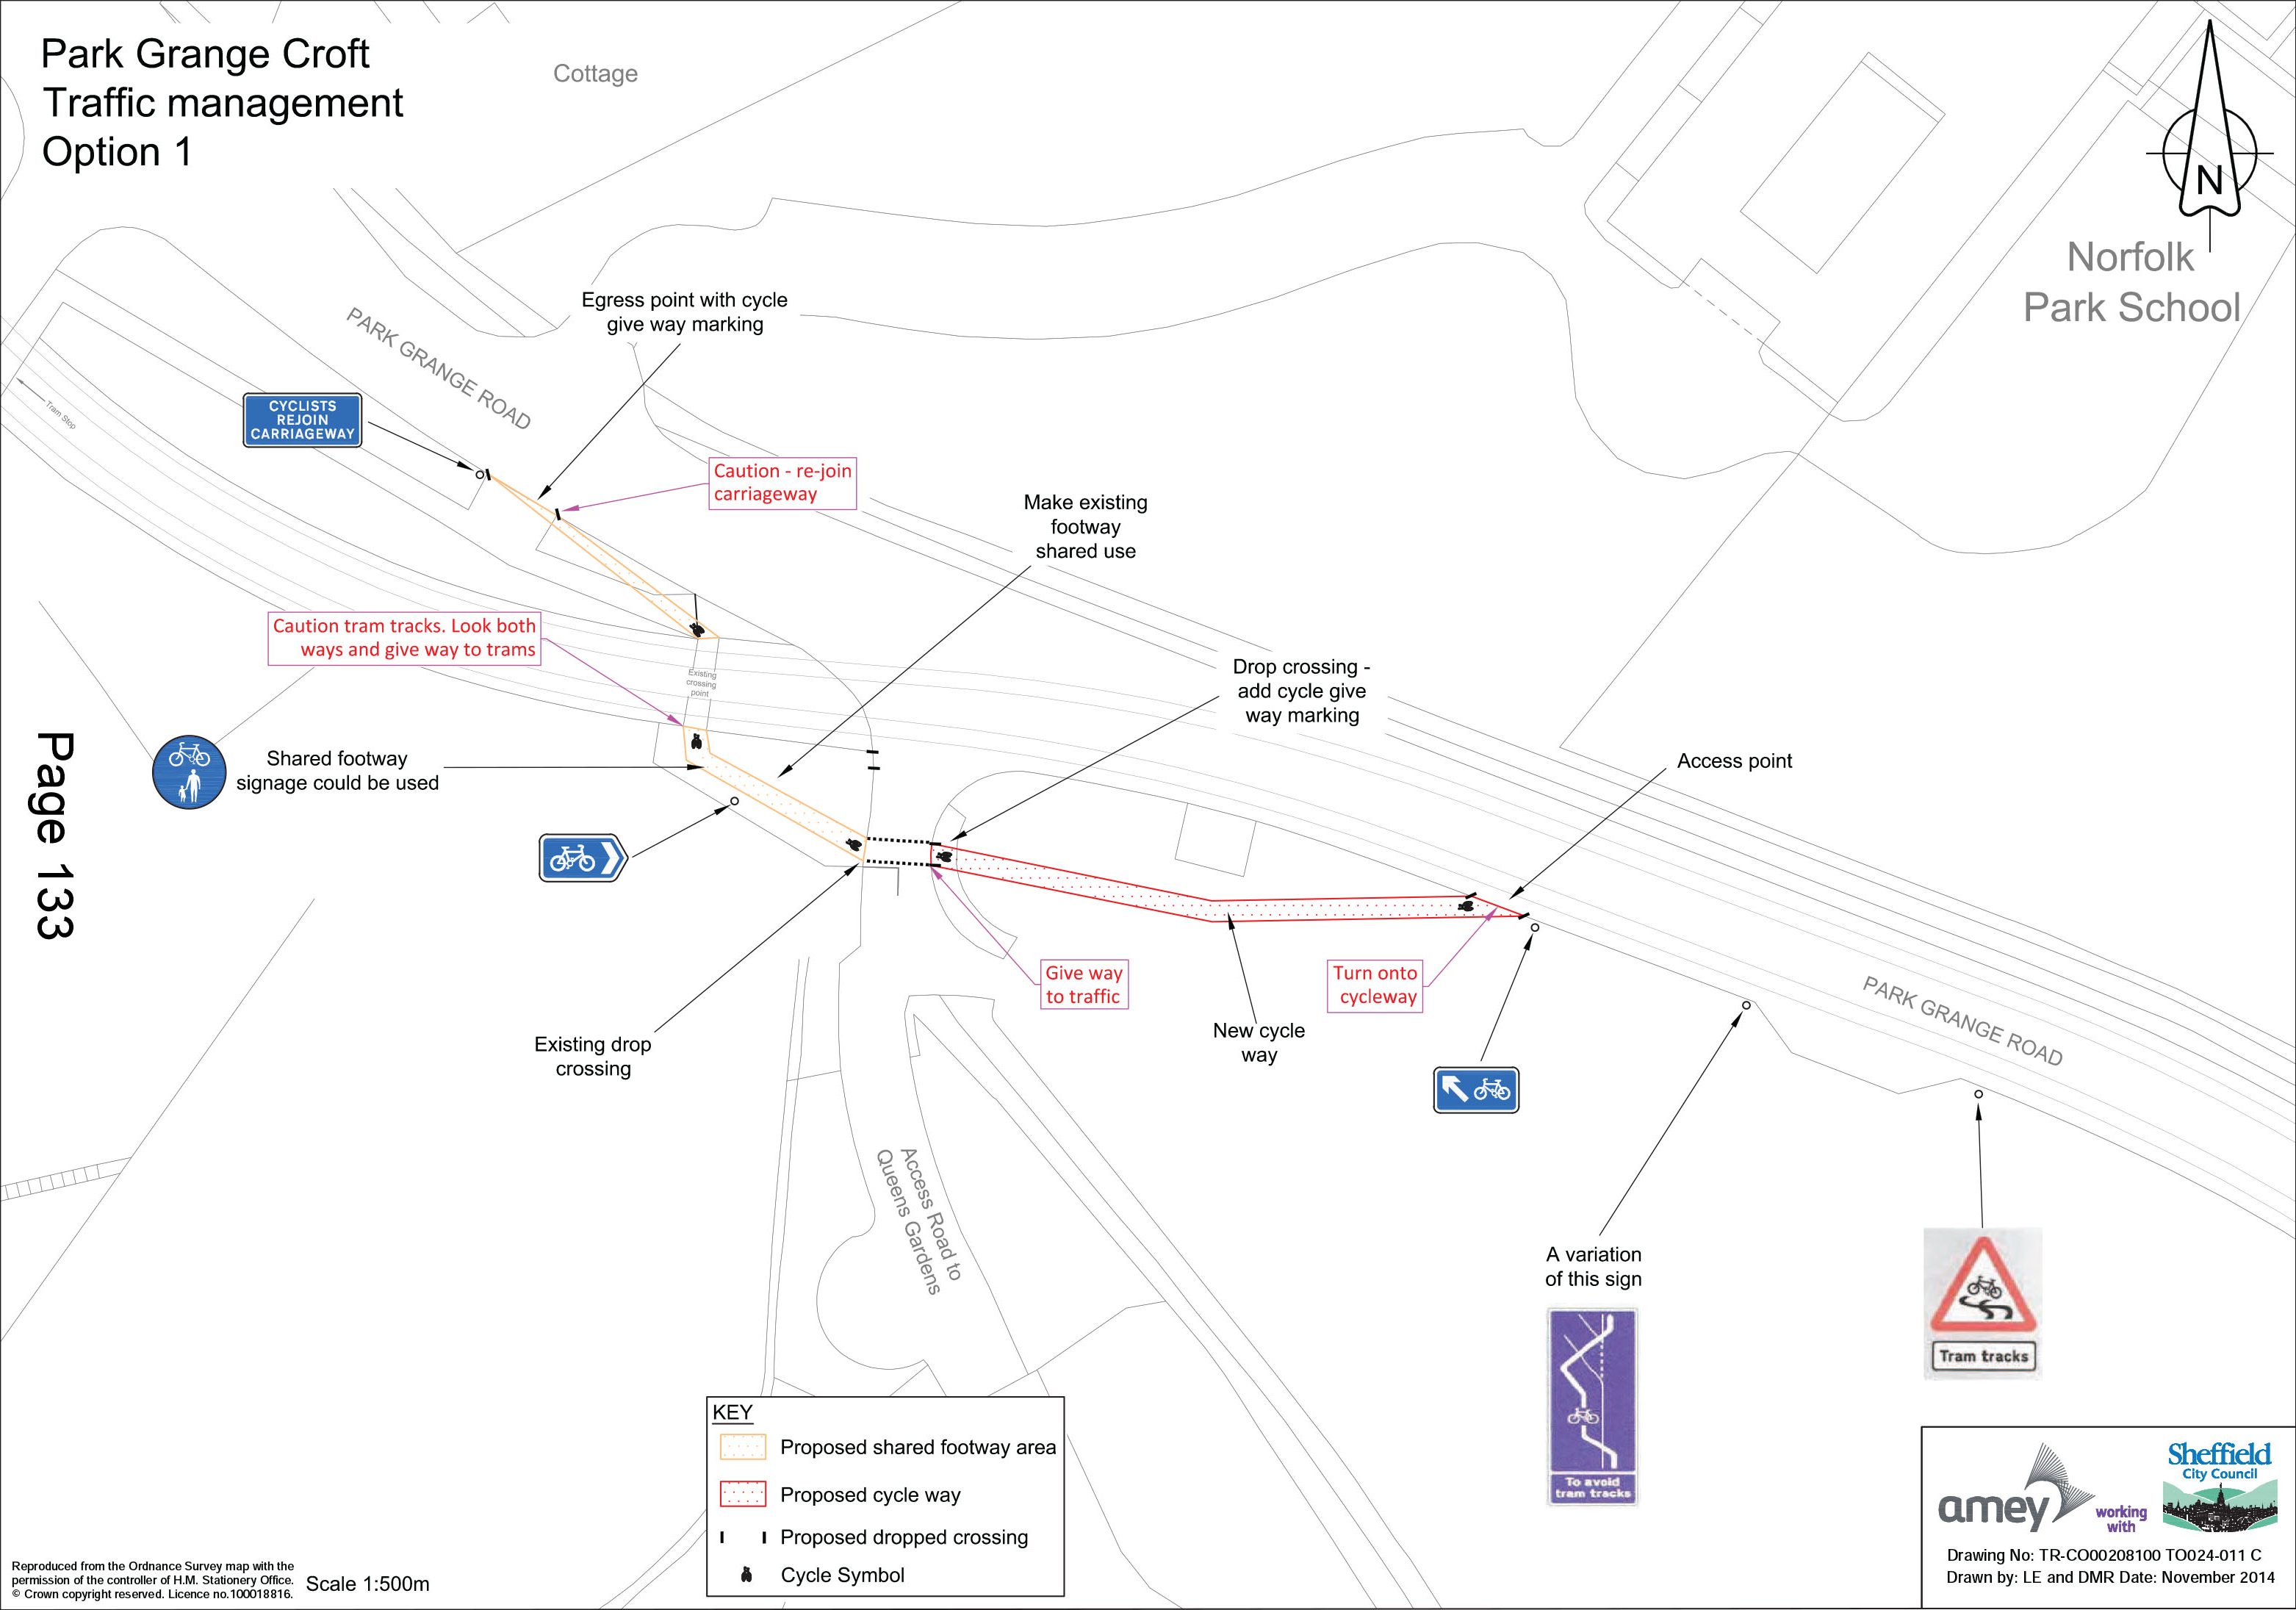
Park Grange Croft Traffic Management Option 1
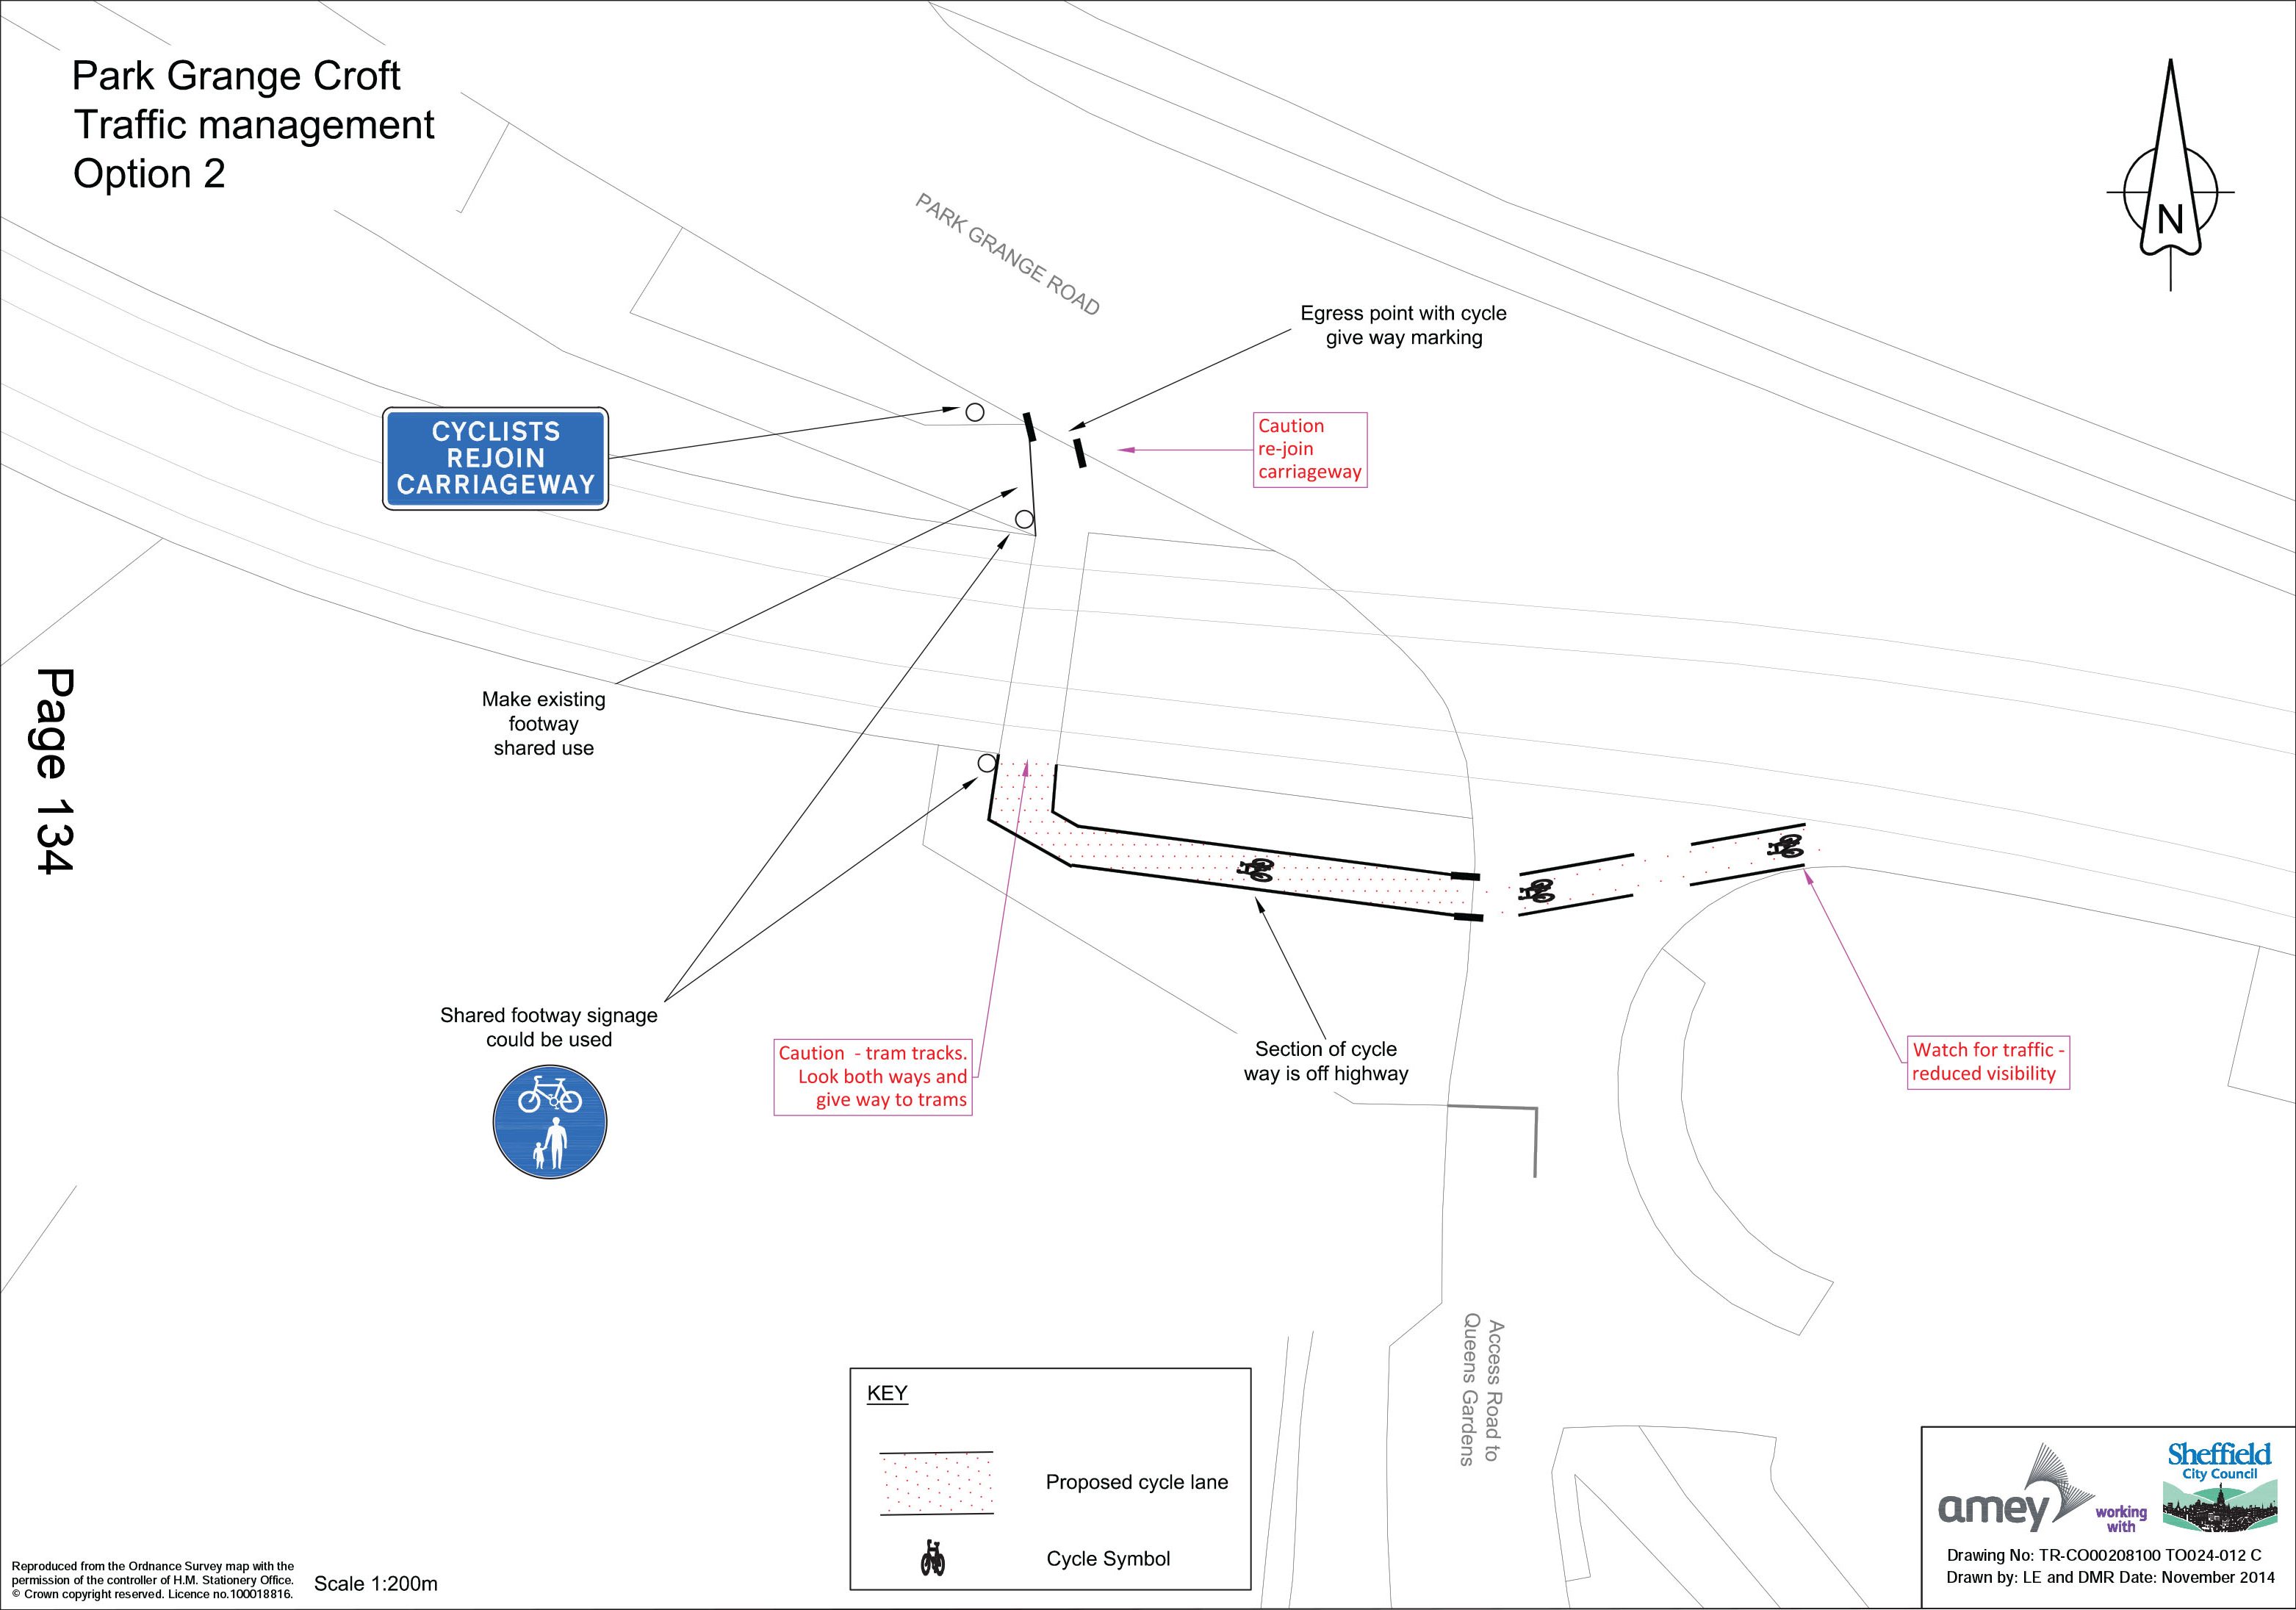
Park Grange Croft Traffic Management Option 2
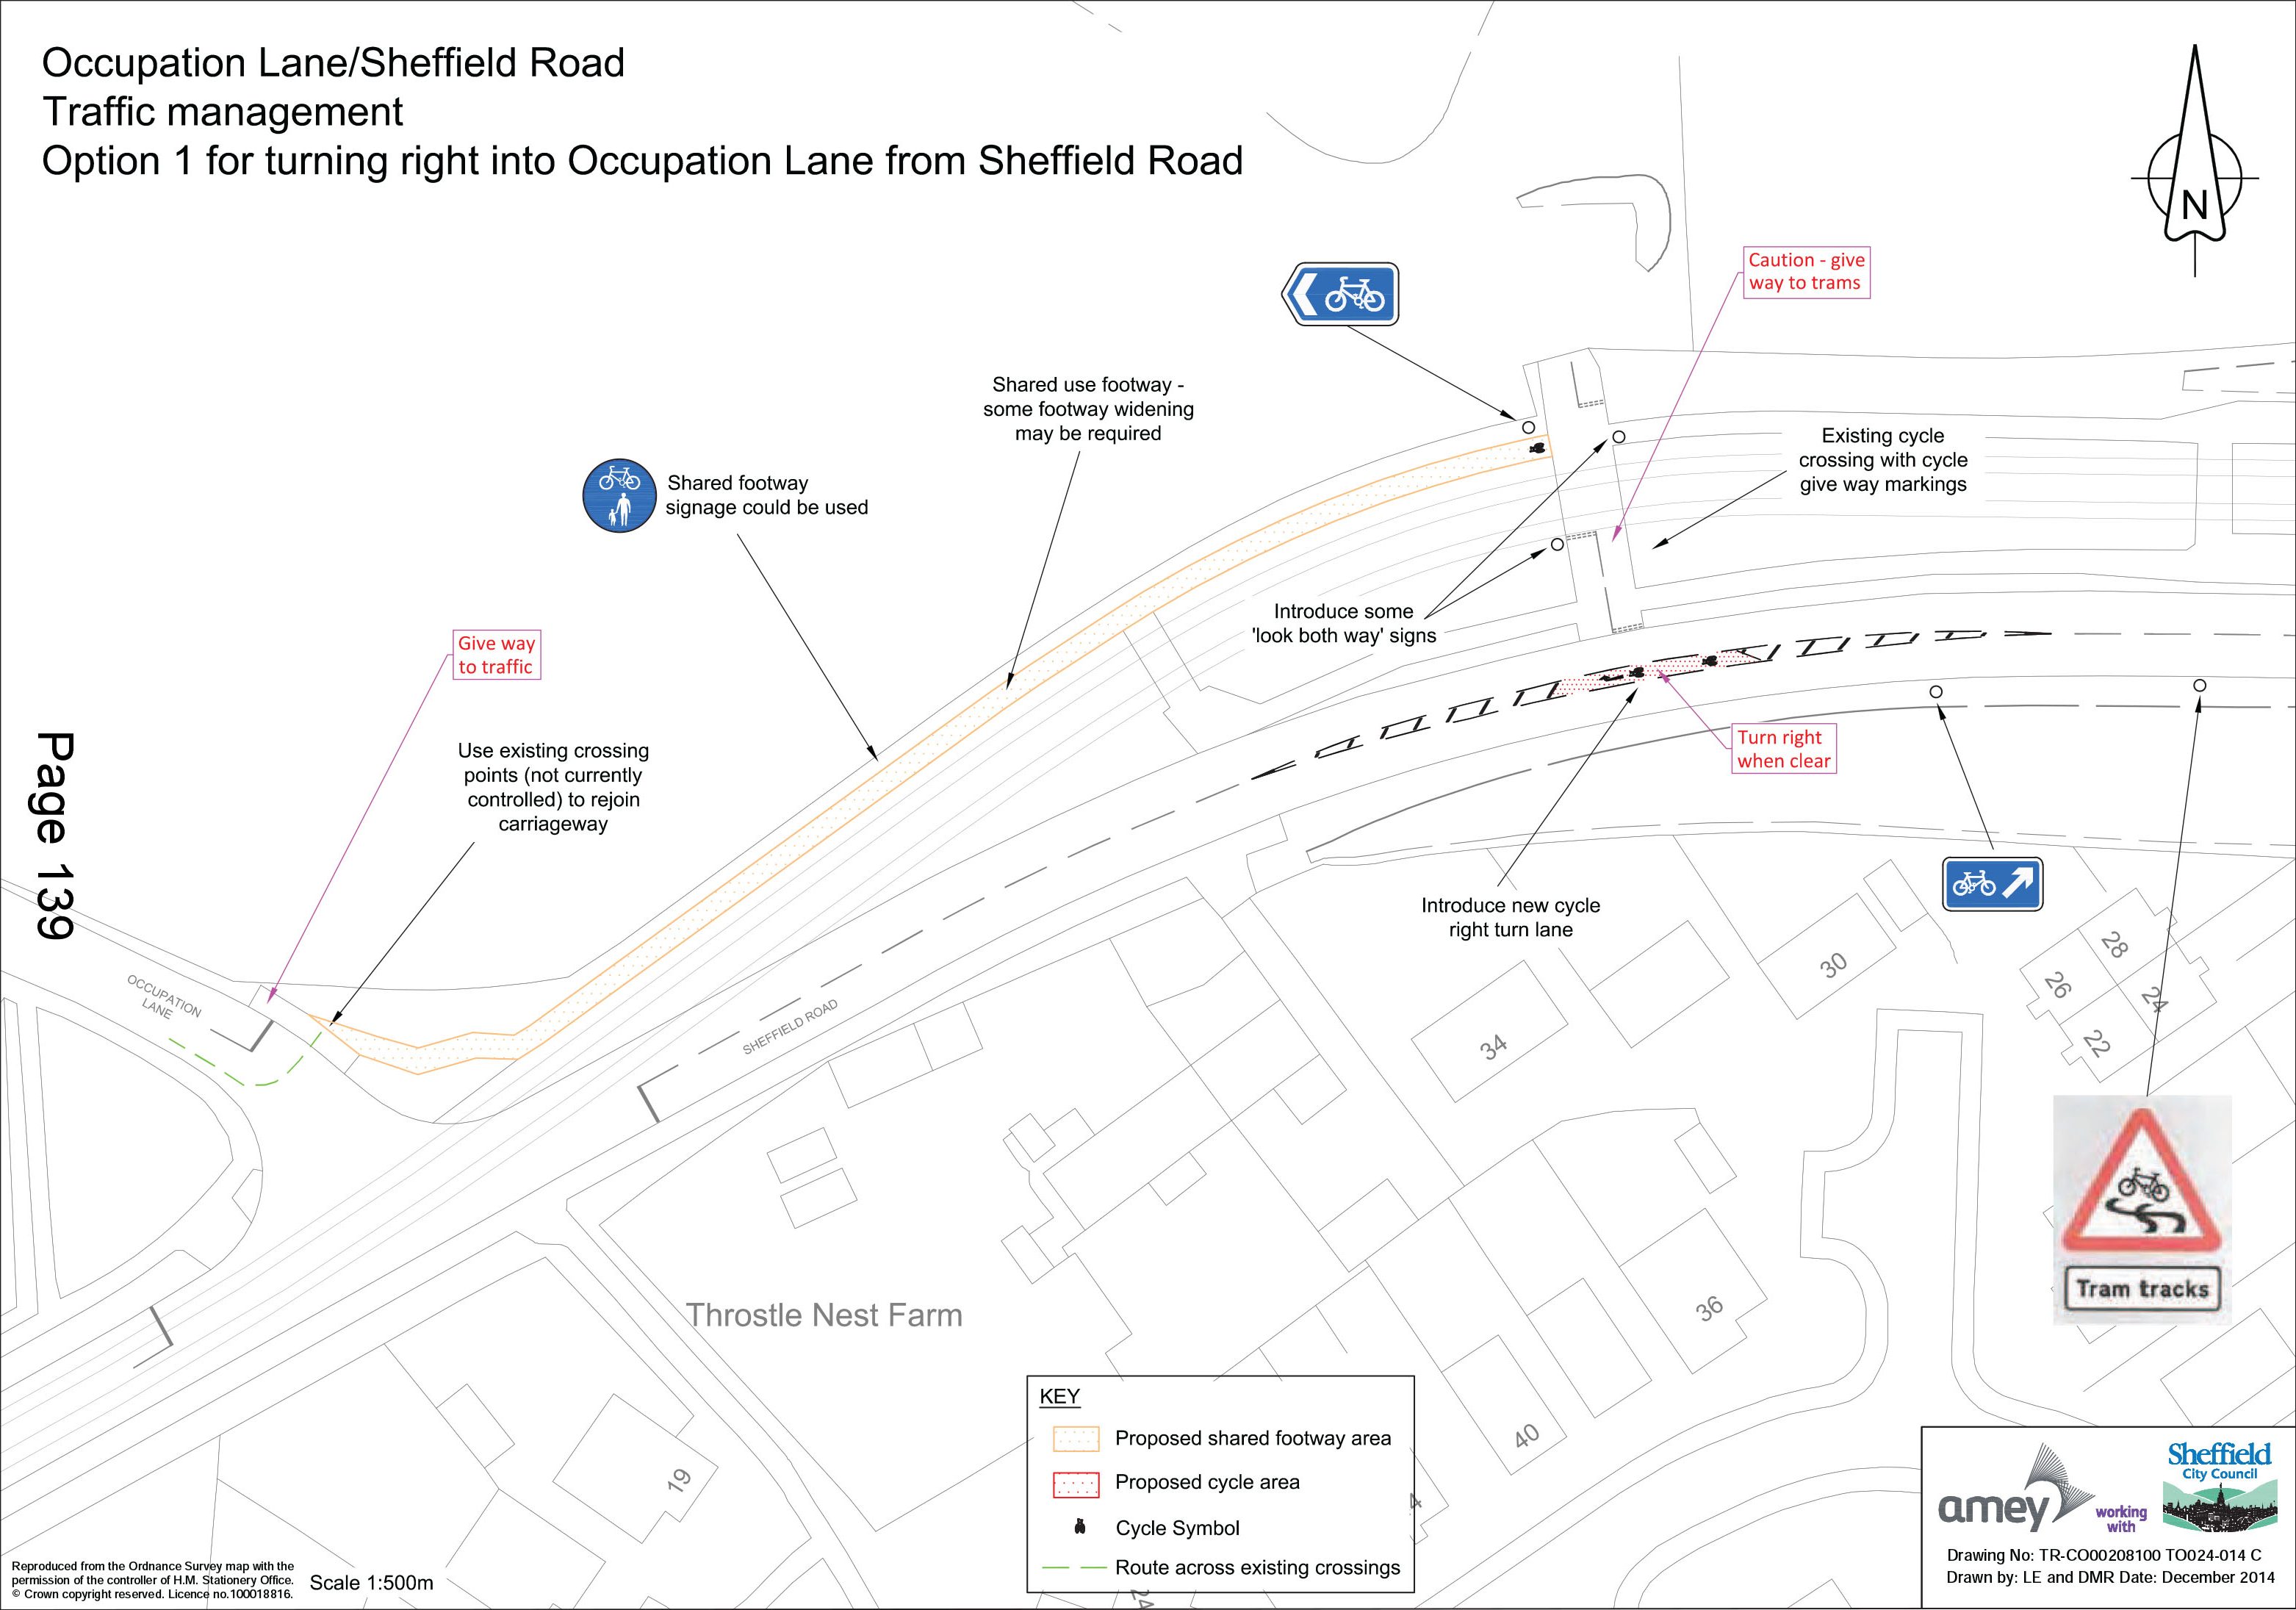
Occupation Lane/Sheffield Road Traffic Management Option 1 for turning right into Occupation Lane from Sheffield Road
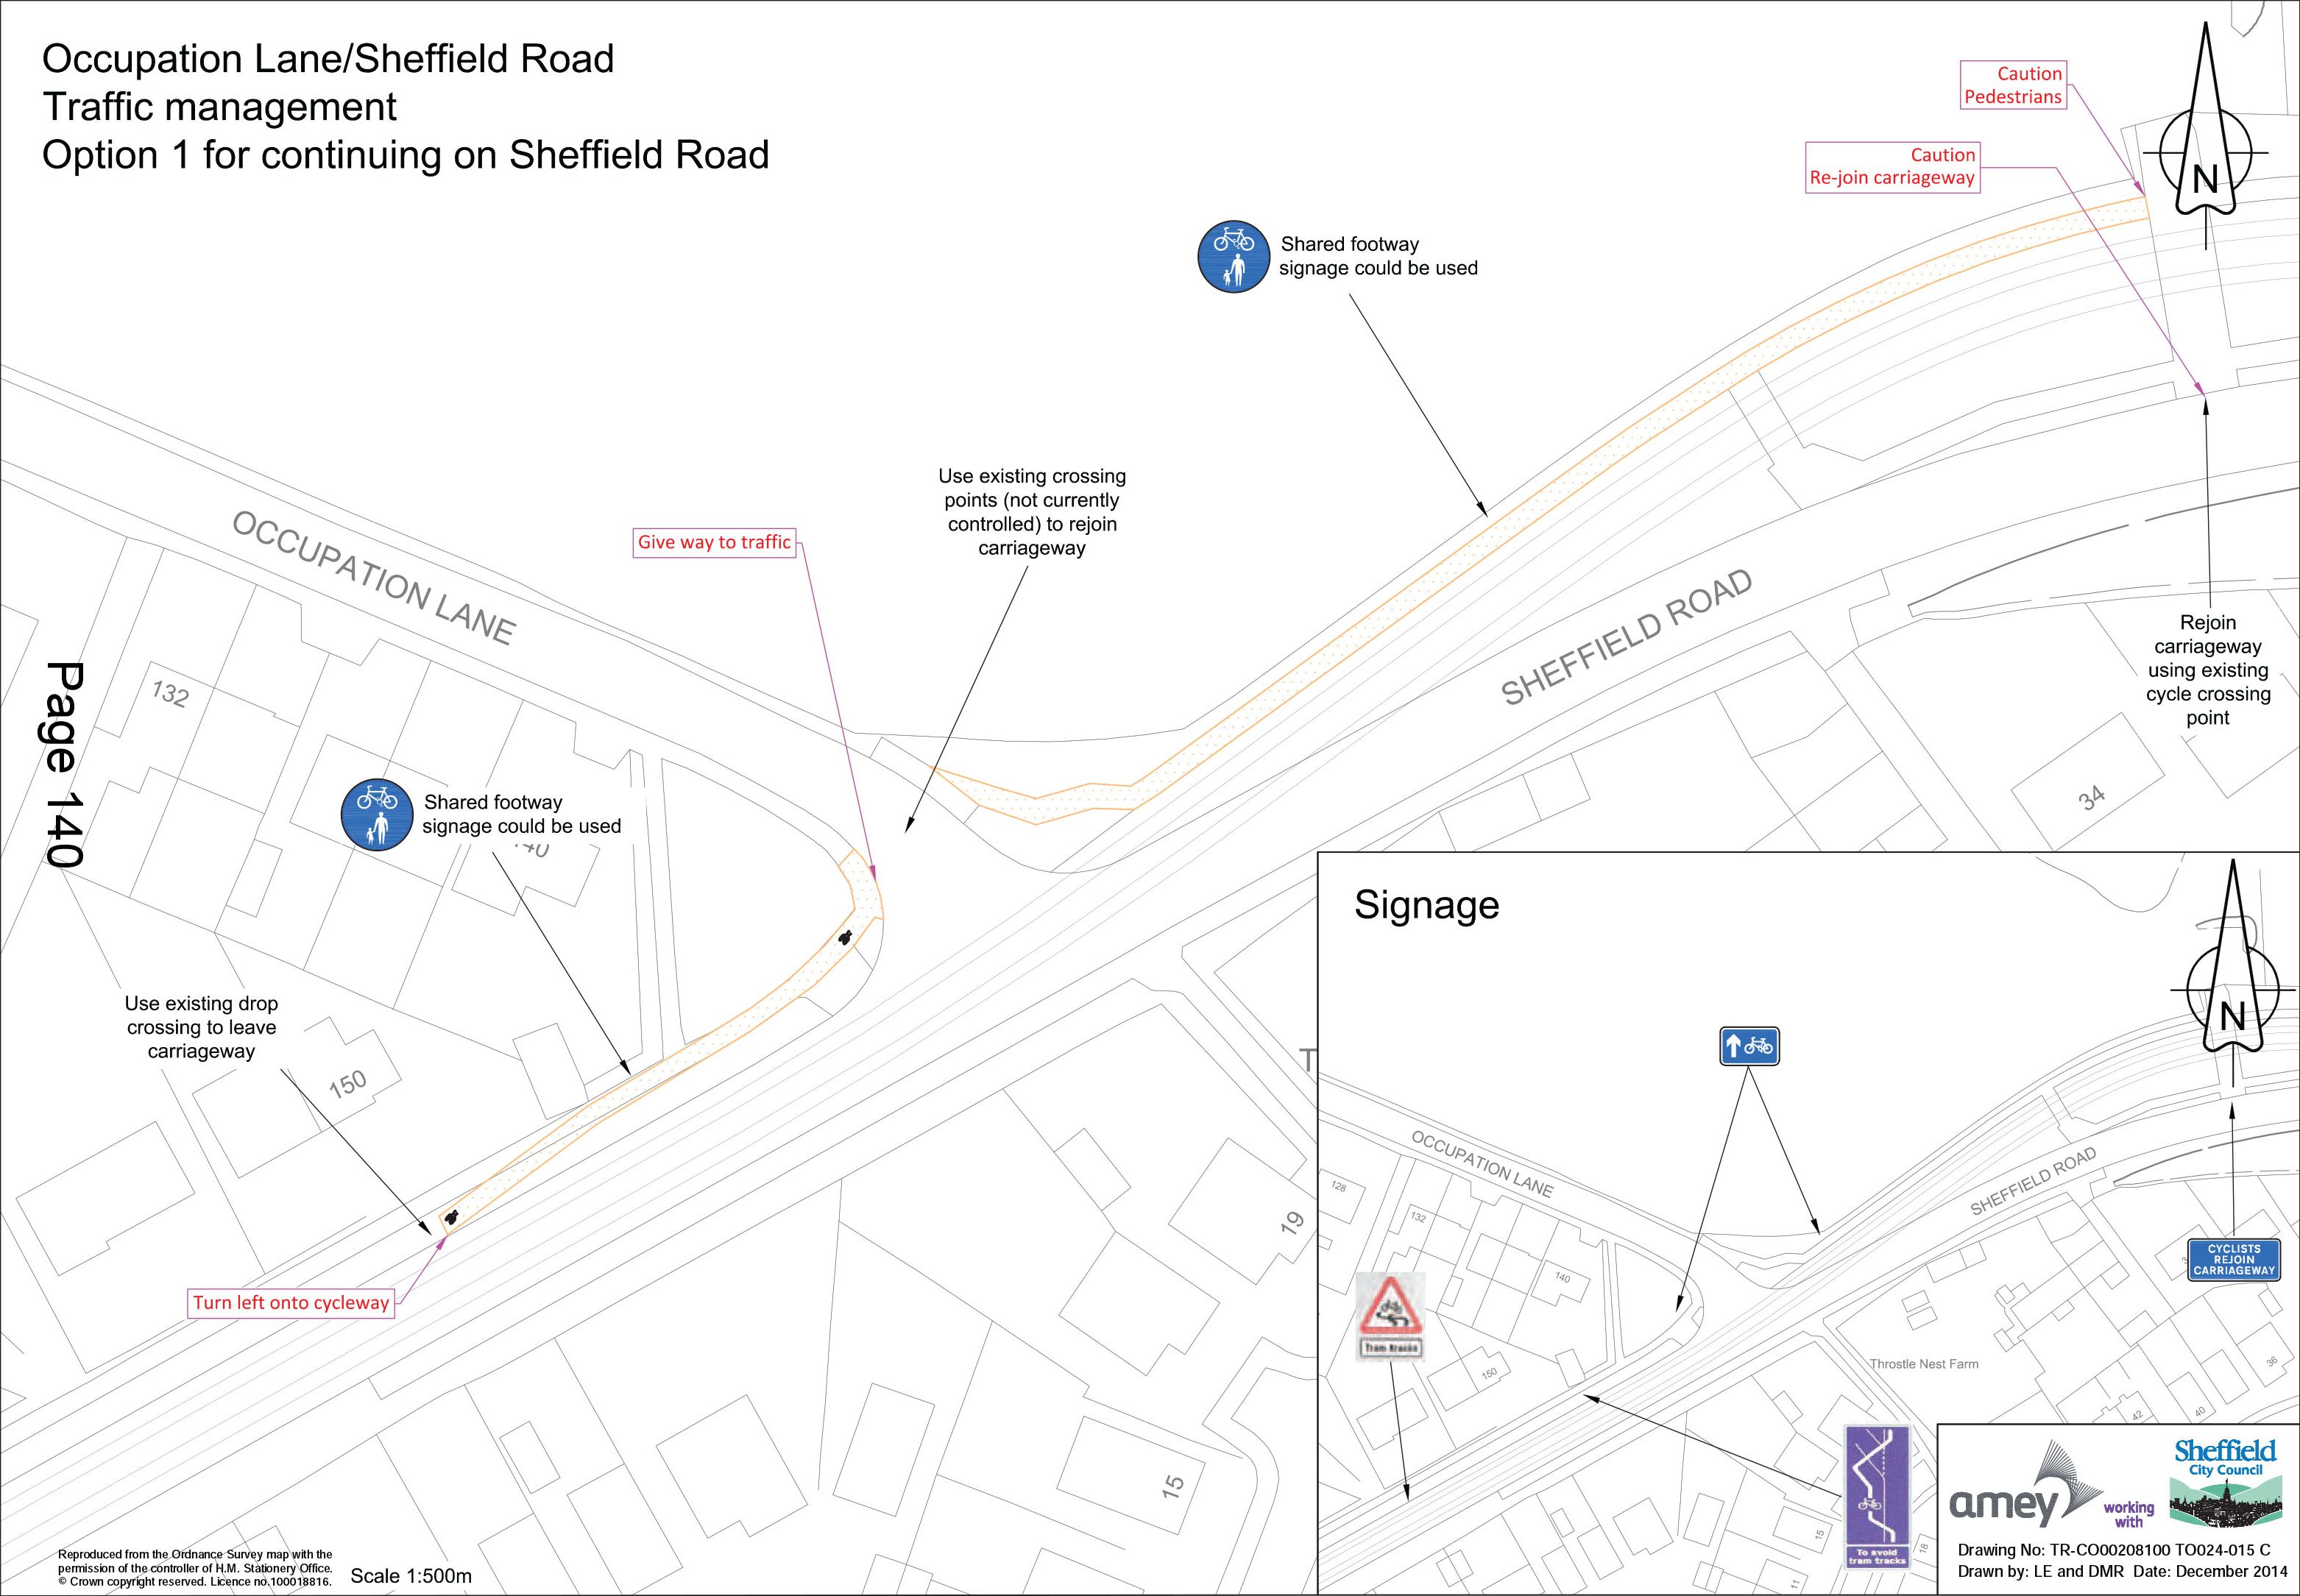
Occupation Lane/Sheffield Road Traffic Management Option 1 for continuing on Sheffield Road
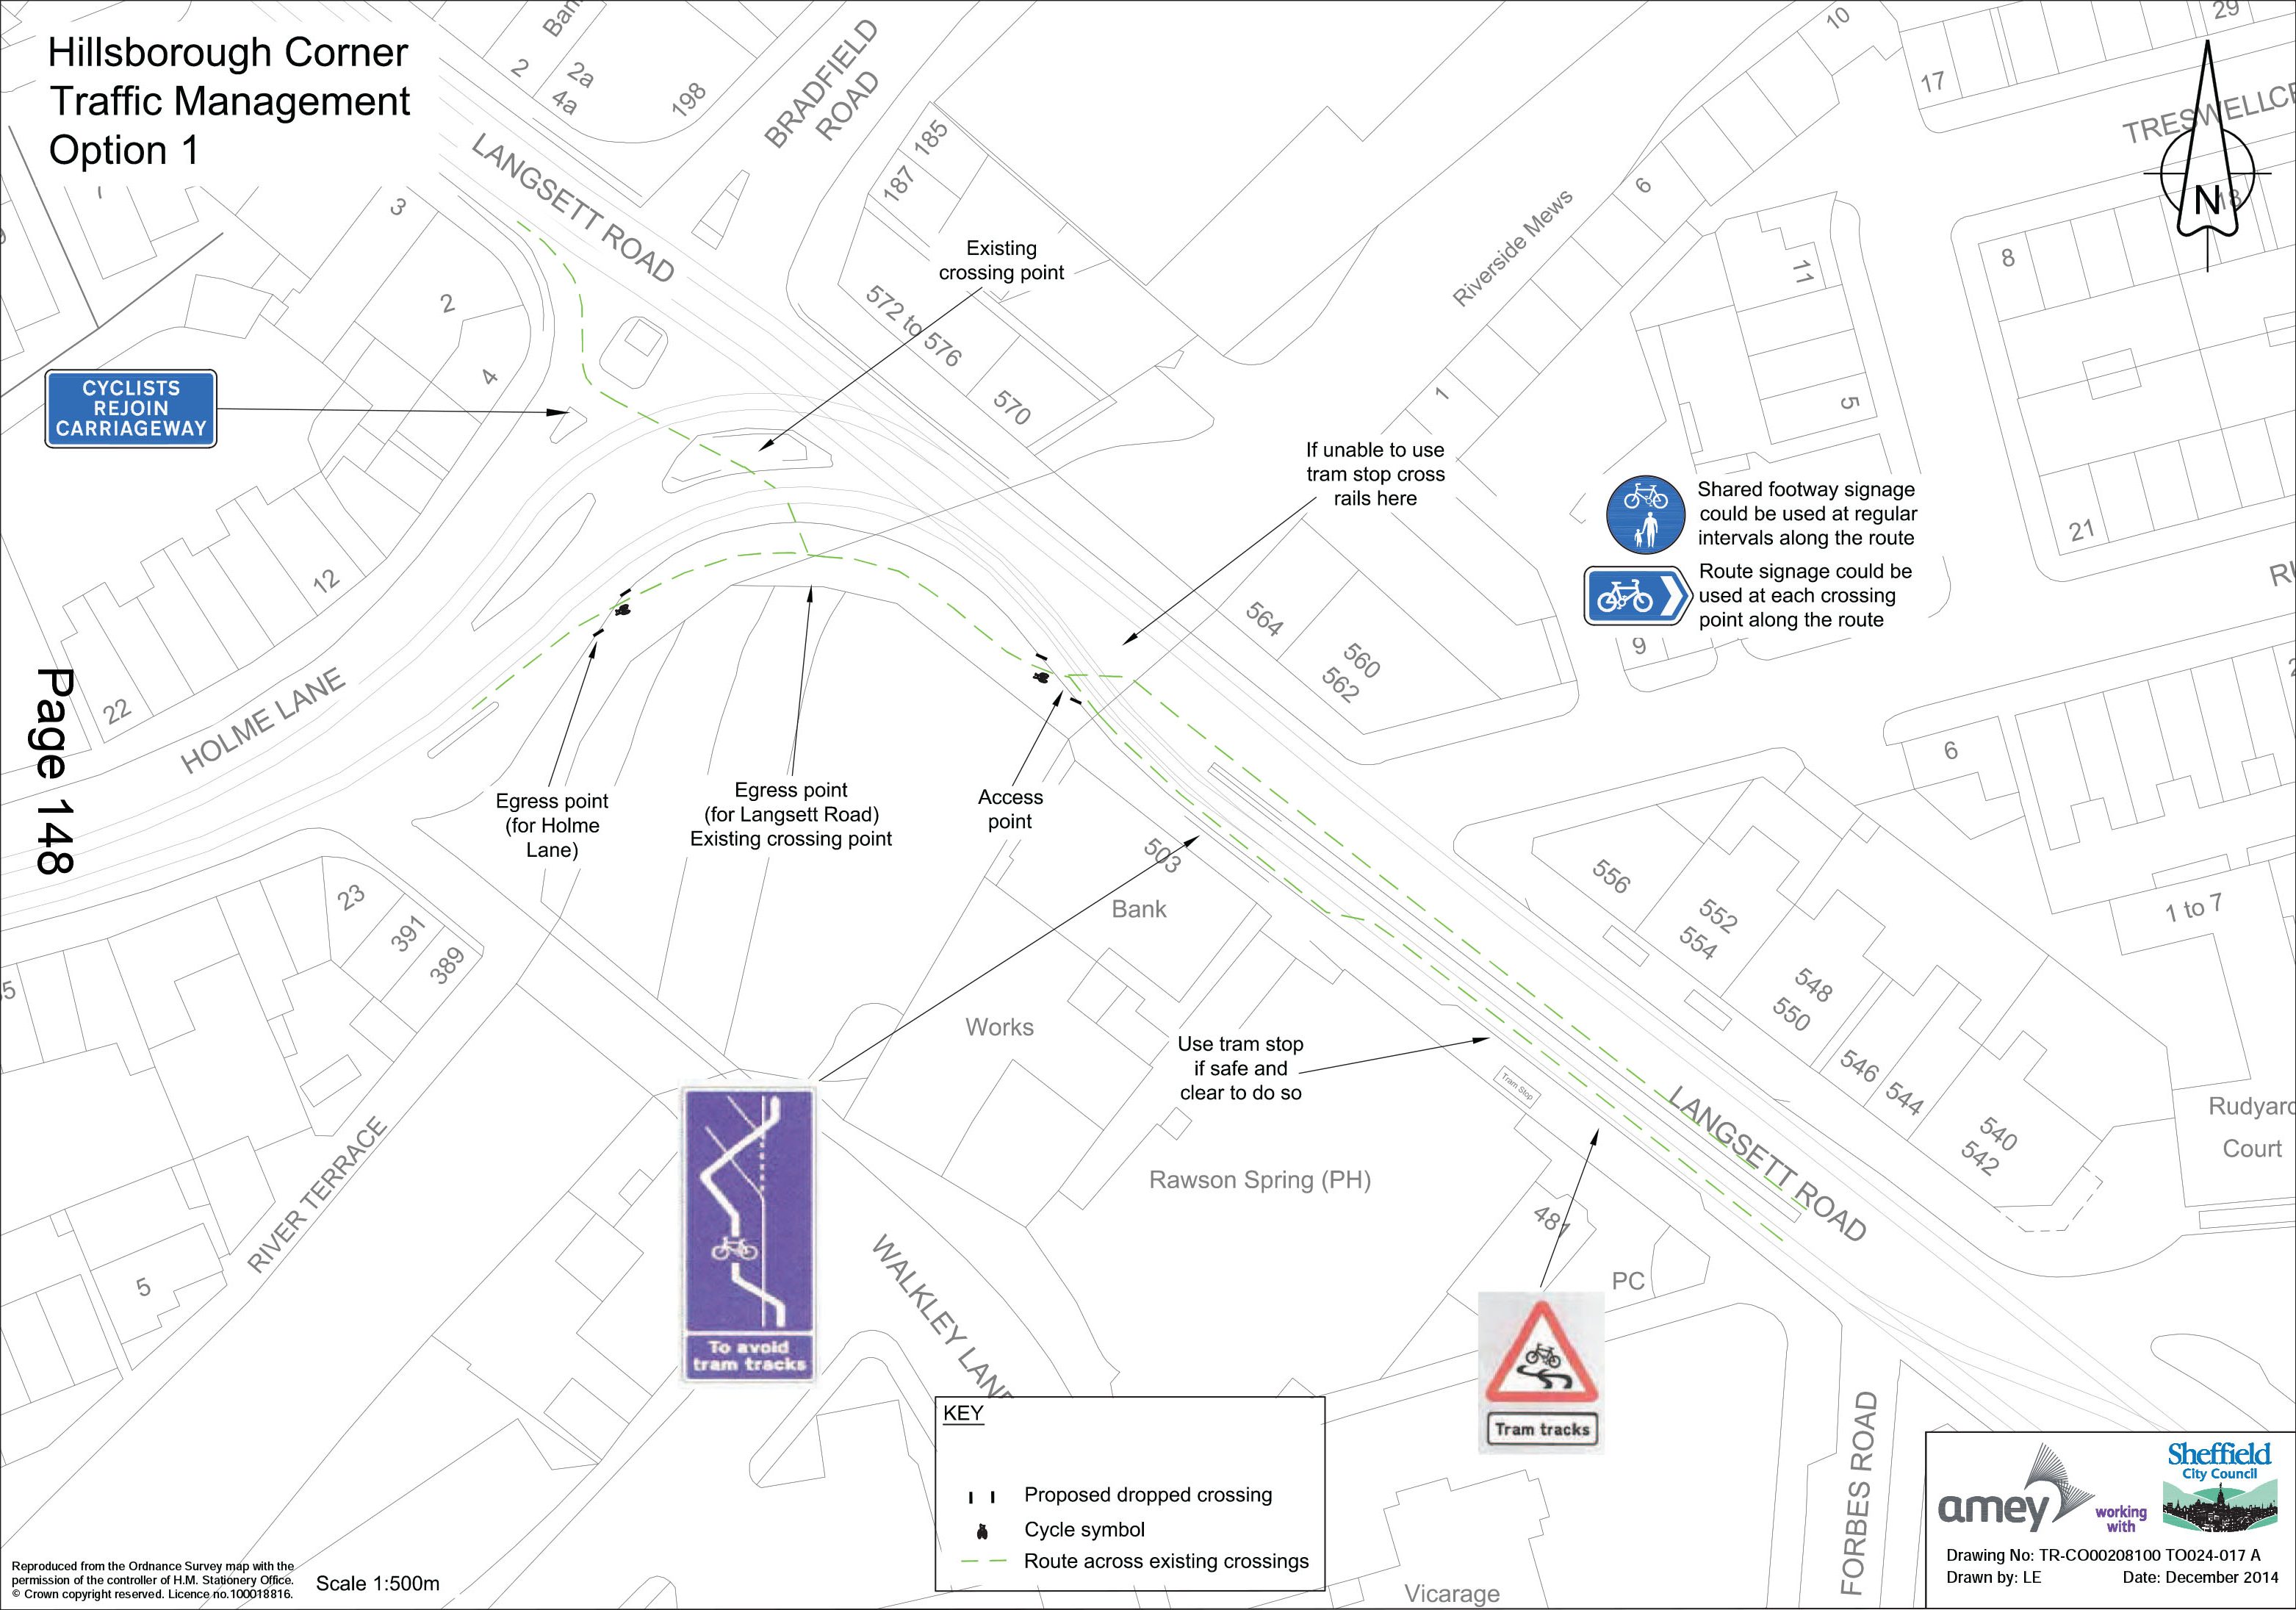
Hillsborough Corner Traffic Management Option 1
Fundamental misunderstanding of how Dutch tramways reduce danger…
There seems to be a fundamental misunderstanding of how Dutch tramways reduce danger, referring to sustainably safe junction layouts as ‘road markings’. The examples from the report below are shown as ‘road markings’ even though they clearly show separated cycle tracks, which provide clear routes across junctions with embedded tram tracks. The layout of these junctions has been designed to be as safe as possible, it’s not the ‘road markings’ that mean that these are safe, and cherry picking and replicating ‘road markings’ alone will not create a safe solution.
…And the best Dutch examples are missing
It’s disappointing that a detailed review of the best high quality cycle infrastructure around tram lines was not included. This example is from Utrecht.
No review of what’s been tried before and why it failed
There is no discussion of Sheffield’s previous plan for dealing with the danger of tram lines, no review of previous programmes of work, no review of their effectiveness, and no discussion of why previous work failed to adequately address the danger. There is no mention of the hospital study conducted in 1994.
No funding, nor any plan to seek it
Funding is non existent, there is no funding plan to go with this report.
Discussion of potential funding sources completely ignores the Sheffield City Region Growth Deal and devolved transport funding, instead choosing to focus on DfT direct funding.
Current tram rail replacement: a missed opportunity?
The report fails to mention the approximately £5 million currently being spent on tram line replacement and fails to identify opportunities from that project to improve the safety of cycling around tram lines.
Failure to look at the bigger picture
This report contains numerous missed opportunities. One if its real shortcomings is its failure to view the tram system as part of the wider street and transport network. Only very immediate localised changes have been proposed (e.g to tram stops, or the roads which have rails themselves), which fail to identify opportunities such as the potential use of service roads alongside tramways as cycling infrastructure. This is something commonly seen in the Netherlands and other European countries.
Service roads like this should be designed to support cycling parallel to the tram lines as is normal in The Netherlands.
We know the council can do better, we’ve seen better designs in the past. The report doesn’t include the visionary design of the crossing of Upper Hanover Street tram lines, perhaps the best piece of cycle infrastructure design to have ever come from Sheffield Council. It’s not even mentioned in the report. (I’m sorry, I don’t have an image for this and I don’t think it’s been published and I think the design was later watered down citing concerns over motor traffic gridlock).
Desperate scrabbling for a ‘behaviour change’ solution
I’ve not even mentioned the suggestion of building a tram line cyclist training facility…
‘Cyclists could also usefully become more aware of traction circle issues’
Shifting the blame for under-reporting of incidents
The report states that ‘adequate data for cycle incidents in relation to crossing tram tracks in Sheffield is almost non-existent’. This is true, but it sets the blame squarely on the shoulders of cyclists, saying ‘these single person accidents tend not to be reported to the Police’ and ‘the only accident data available is when cyclists report incidents to SCC, SYPTE or Supertram… under-reporting of these types of incidents could be significant’.
This is a misrepresentation the situation. Research by CycleSheffield has found that when cyclists report these crashes to the police, they often refuse to accept the report. The Sheffield Council cycle forum has even sent a letter to South Yorkshire Police expressing concern at their failings to record these crashes. Another route is to report incidents to the Council or Supertram but people are often fobbed off just the same (as documented by CycleSheffield).
“I tried to report it to the police via 101 and they insisted that it was not reportable.”
“Supertram, they were not in the slightest interested and told me I should have gotten off my bike and walked across the junction.”
The blame for a lack of data lies squarely with our local authorities.
If you’ve crashed on the tram lines then report it at tramcrash.co.uk which is run by CycleSheffield. They collect the information and anonymously share it with whoever needs it (including Sheffield City Council). They have created an up to date map of all reported crashes.
Conclusion
So, to sum up, very very disappointing. I hope that CycleSheffield are able to put pressure on Sheffield City Council to improve this report. As a proven major cause of injury and distress, cycle crashes on Sheffield’s tram tracks should be taken seriously. Sheffield City Council says it wants to increase the number of journeys made by bike in the city, now we need some action to prove it.
Update (June 2016)
And they have, the report has been pulled from the council meeting agenda pending further discussion.
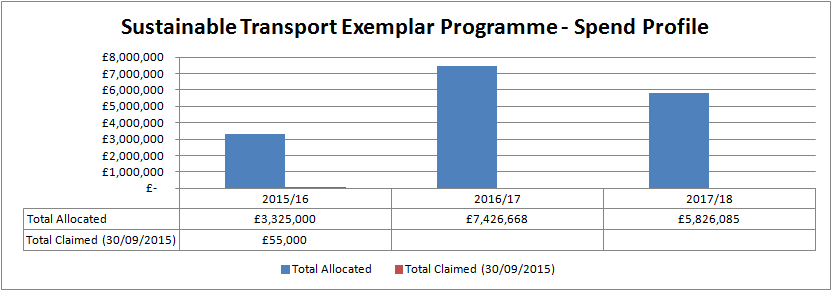
As part of the Sheffield City Region Growth Deal, announced in 2014, a £16.3m investment allocation was made towards a Sustainable Transport Exemplar Programme (STEP). Let’s look at how that’s going. This information is from item 13 of this meeting.
STEP Funding Profiles
The full list of projects is available here. The ones in Sheffield are in the table below. As of 30/09/2015 no money had been claimed.
2015/16 Funding as 02/03/2015
2015/16 Funding as 23/11/2015
Claimed (30/09/2015)
Comment
SS01
Greenhill Parkway / Greenhill Avenue
£350,000
£0
£0
Project cancelled – ‘intentionally delayed, and its 2015/16 funding allocation reallocated, whilst SCC officers consider an alternate funding regime’
SS02
Grey to Green Phase 1 – Sheffield Riverside Business District
So… lets me honest here, the STEP is definitely not a step up in provision, it’s more of the same, and as far as I can tell, there’s zero road space allocation towards cycling.
And the Meadowhall Car Park extension which had £670,000 allocated to it for this year? That’s been pushed out, £1.45million next year, and £1.25million the following year, £2.7million, 16% of the entire STEP budget, on a car park.
Each year Sheffield does a traffic count in September and October. It includes both a cordon count and an occupancy survey for some roads and also some off road cycle routes. A map of the count locations is here and here). This document describes how it works. The data collected is aggregated into 15 minute chunks. The data has been collected since 2001, I do not know what was collected before then.
Summaries of the data can be obtained from Sheffield Council by writing to them (I think it should be published on their website, but until that happens I’ll publish what I have here).
Looking at the count locations. They have very good coverage of people traveling into and out of the city centre, there’s much less information about areas further out.
Modal split for 2014 looks like this, for both vehicles and people (taking into account occupancy data).
2014
Total Person Trips / Mode
Proportion Person Trips / Mode
Vehicles / Mode
Proportion Vehicle Trips / Mode
Car / Taxi
521,782
56.02%
414,878
71.00%
Bus / Coach
159,507
17.12%
14,948
2.56%
Walk
69,049
7.41%
69,049
11.82%
Light Goods Vehicle
65,077
6.99%
55,056
9.42%
Tram
49,889
5.36%
1,283
0.22%
Rail
37,094
3.98%
180
0.03%
Medium Goods Vehicle
10,898
1.17%
10,898
1.86%
Heavy Goods Vehicle
7,258
0.78%
7,258
1.24%
Pedal Cycle
7,160
0.77%
7,160
1.23%
Motor Cycle
3,774
0.41%
3,658
0.63%
931,488
100.0%
584,368
100.0%
Of course, cars dominate, with 56% of all journeys being made by car. Public transport is next at 26% (bus=17%, tram=5% and train=4%). Walking has 7.4% of journeys, and cycling at 0.77% of journeys.
Because the data above have both occupancy data and vehicle count data, it’s interesting to look at how hugely efficient public transport is. Buses make up just 2.6% of the traffic, but carry 17.1% of journeys, trams make up just 0.2% of the traffic, but carry 5.36% of journeys, and trains, just 0.03% of vehicles (180 of them) but carry 3.98% of journeys.
Looking at motor traffic (cars/taxis), they make up 71% of the vehicles, but just 56% of journeys were made by car, very inefficient.
Car/taxi occupancy has been slowly declining over the past decade, but there has been a more substantial drop from 2012 to 2013. Car/taxi occupancy in 2014 was just 1.25 people per car/taxi.
Car/Taxi Occupancy Rates in Sheffield
The number of person trips being counted each year has been steadily declining. A drop of 10.3% from 2001 to 2014, from 1,038,366 to 931,488 in 2014.
Total Person Trips in Sheffield 2001 to 2014
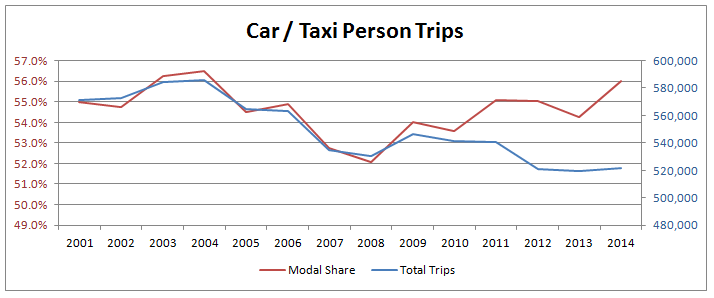
The modal share has been changing too. For cars/taxis the number of person trips has been declining (blue), but the modal share (red) has remained reasonably steady (albeit with a drop to 52% in 2008.
Car Taxi Person Trips Modal Share and Total in Sheffield
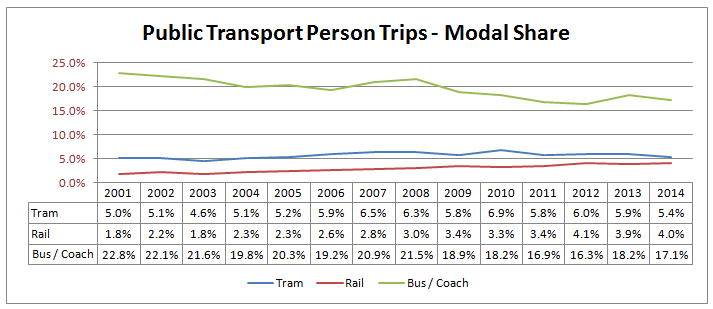
For public transport (rail, tram and bus), the number of trips was fairly steady until 2008, and then has declined consistently since. From about 31% modal share to 26.5%.
Public Transport Person Trips in Sheffield 2001 to 2014
Splitting this down into each of the three modes makes clear what’s going on.
Tram modal share has been fairly steady, but down in the past couple of years (the reason could be significant tram track maintenance).
Rail has seen a significant increase both in modal share and absolute numbers of trips, from 1.8% to 4.0%, and 18,823 to 37,094 from 2001 to 2014 respectively.
But buses have seen a significant drop. From 22.8% in 2001 to 17.1% in 2014, the absolute number is revealing, 236,909 trips to 159,507 trips from 2001 to 2011. A drop of 32.7%, there are now a third fewer journeys made by bus, in just 13 years.
If total trip numbers start to increase (post recession), unless this downward trend in bus patronage is reversed then we’ll see a huge growth in private car traffic on our streets and that will be very problematic.
Public Transport Person Trips, split by mode, in Sheffield 2001 to 2014
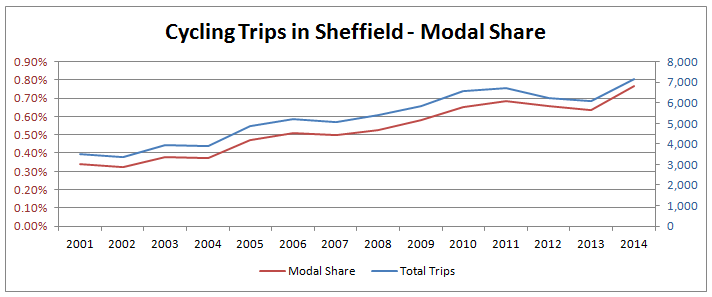
Onto cycling. In 2014, 1.21% of vehicles, and 0.77% of person trips counted we cycles, just 7,160 in total. Cycling is second to bottom in modal share, only motorcycles have fewer journeys.
Since 2001, levels have increased from 3,250 to 7,160, 0.34% modal share to 0.77% modal share.
Cycling in Sheffield – Modal share from 2001 to 2014
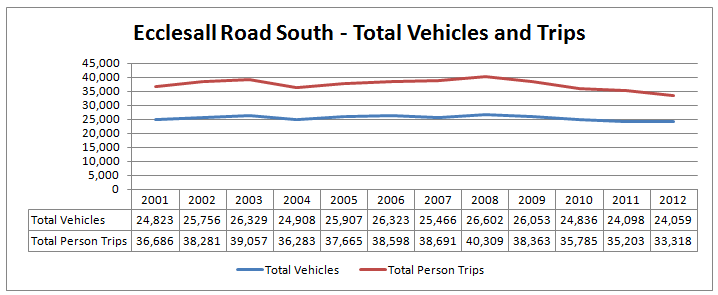
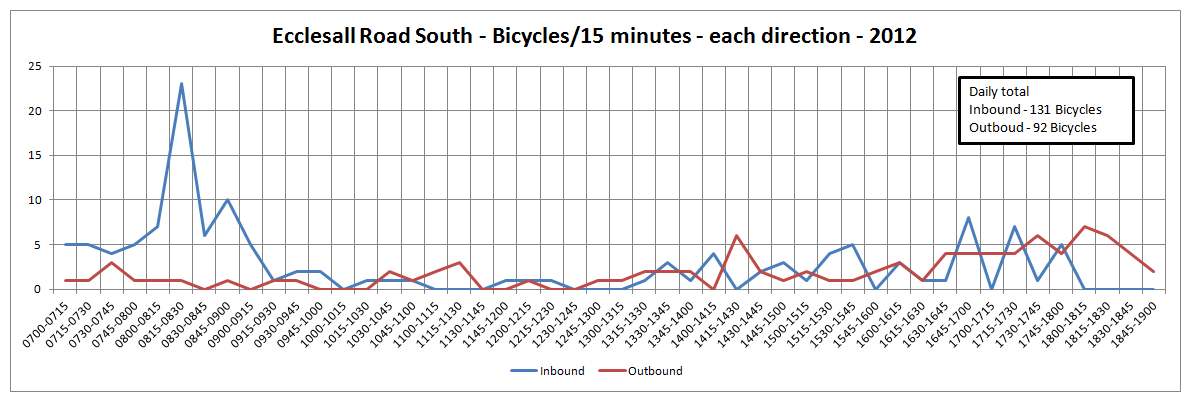
Ecclesall Road South
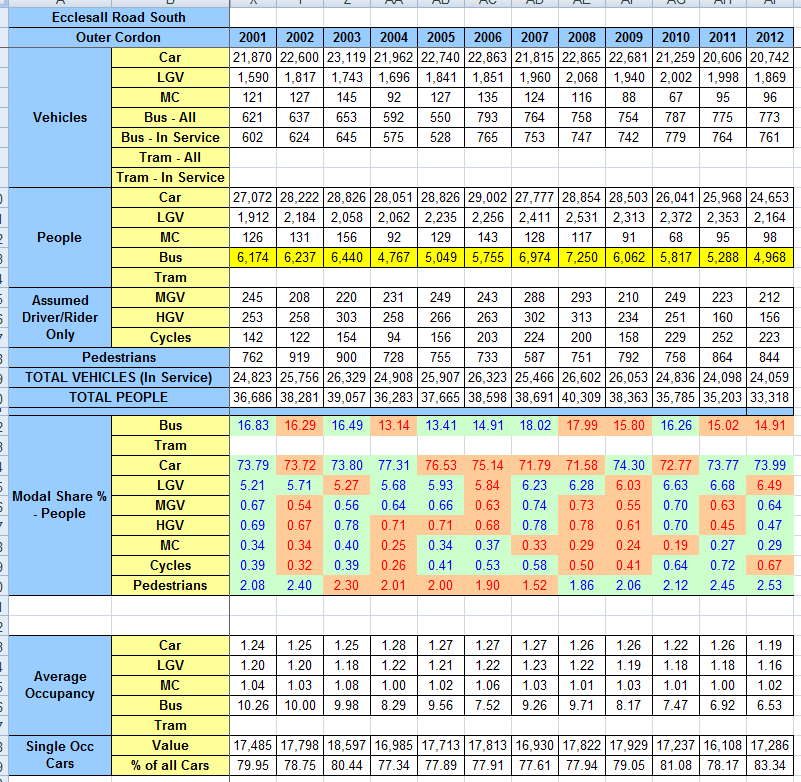
Further to this summary published data, the council hold detailed 15 minute data for each site. I’ve tried to request it’s release in the past via FOI, but I’ve been unsuccessful, apart from receiving one sites data for one year. Ecclesall Road South, 2012.
Across the whole day, for Ecclesall Road South, the number of people traveling along this road has fallen from 36,686 to 33,318. The number of vehicles has broadly remained constant.
Ecclesall Road South – Total Trips and Vehicles
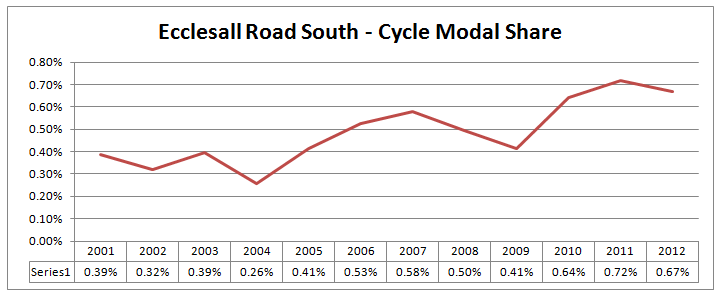
Cycling levels have increased from 142 per day in 2001 to 223 per day in 2012 (0.67% modal share). Cars down from 27,072 person trips to 24,653. The number of single occupancy cars has increased from 79.95% to 83.34%. People walking, up from 762 to 844. Public transport (bus only) person trips down from 6174 people to 4968, but an increase in bus vehicles from 621 to 773. The data is below.
Ecclesall Road South – Bicycle Modal ShareEcclesall Road South Detailed Data
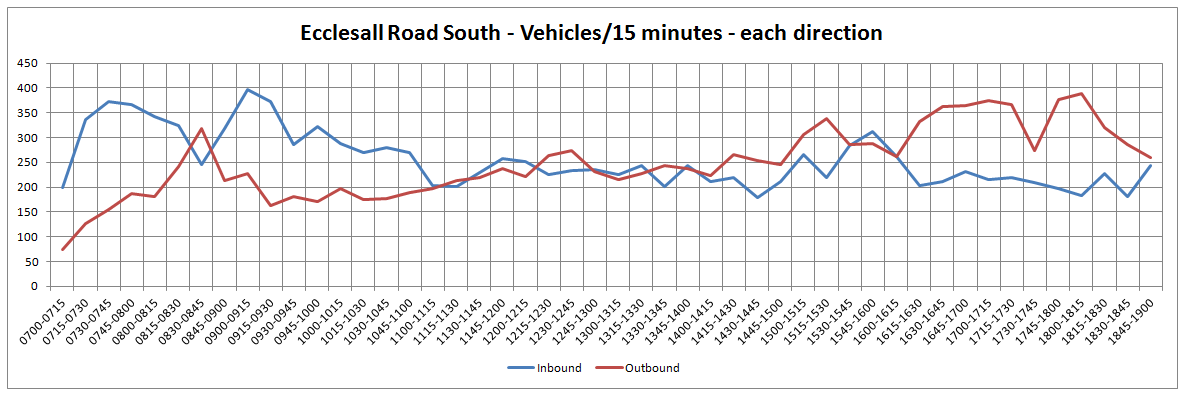
We also have detailed data for one day in 2012, broken down by direction. There were between 200 and 400 vehicles per 15 minutes across the whole day in each direction.
Ecclesall Road South – Vehicles Across Day – 2012
And for just bicycles, there were just 223 across the whole day, 131 inbound and 92 outbound. At a maximum rate of 23 between 08:15 to 08:30 (a modal share of about 3.7% in that 15 minute period). The modal share for the majority of the day is under 0.5%.
Ecclesall Road South – Bicycles Across Day – 2012
We can also break down the number of cars by occupancy. 1 occupant = 83.3%, 2 occupant = 14.8%, 3 occupant = 1.6%, 4 occupant = 0.03% (just 60 out of 20,742 cars).
That’s it, a whistle stop tour of traffic count data available in Sheffield. 2015 counts were done very recently (although I understand that they were late). I’ll do another post when I get a copy of the data.
Pavement parking is a huge problem in Sheffield, especially on the main roads in the city centre where people seem to be able to leave their vehicles with impunity. I try to work with Sheffield City Council (as part of CycleSheffield) to get the vehicles ticketed and moved on, but often they say there isn’t anything they can do because there are no double yellow lines.
It’s a problem for me, both walking around, and cycling, because the same rules apply to cycle paths. It’s often not possible to prevent people from parking on cycle paths, blocking them. Just yesterday (Saturday) cars were parked blocking the Penistone Road cycle path.
I would like you to attend the debate of this bill and speak in support of it to give our local authorities the powers they need to keep our pavements clear of parked cars.
Just a few weeks ago, I saw vehicles parked 3 abreast on the pavement on West Bar Green. I watched as people walking in the dual carriageway to get around. Neither the Police, not the council, would/could do anything about it.
I understand the pavement parking bill would not introduce a blanket ban, but would instead only allow pavement parking to take place on streets that have been specially designated to allow it, making it the exception rather than the rule. I understand that in lots of residential areas, the problems would need significant work to solve.
This bill could make a big difference to people in your constituency and more vulnerable people in general, and it needs your support to reach its progress to the next parliamentary stage.
Please let me know if you plan to back the bill on 4 December.
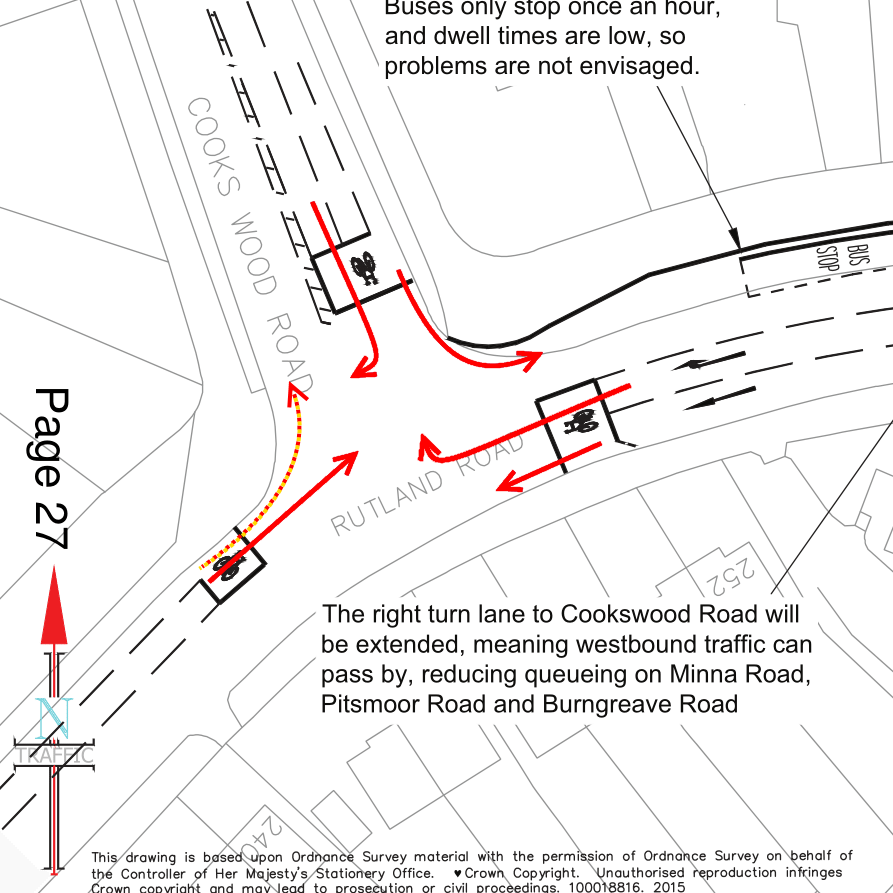
“Buses are delayed due to congestion, and limited road width, along Pitsmoor Road.”
The solution is “a scheme to address the delays, which comprises road widening, revised road markings and a new pedestrian crossing point”, costing “around £300,000 which includes for design, construction, supervision, contingency and commuted sum. It is to be funded from the Passenger Transport Executive’s 2016/17 Better Buses programme”.
The fundamental problem is that the right turn lane into Cooks Wood Road from Pitsmoor Road is of insufficient capacity to cater for the number of vehicles. Consequently this queue blocks other movements and causes delays. The scheme addresses this by widening the carriageway on the northern side of Rutland Road, allowing the right turn lane to be extended. Pedestrians also have difficulties crossing at the junction, so a new refuge island is to be provided to offer better crossing opportunities without causing undue delays to traffic.
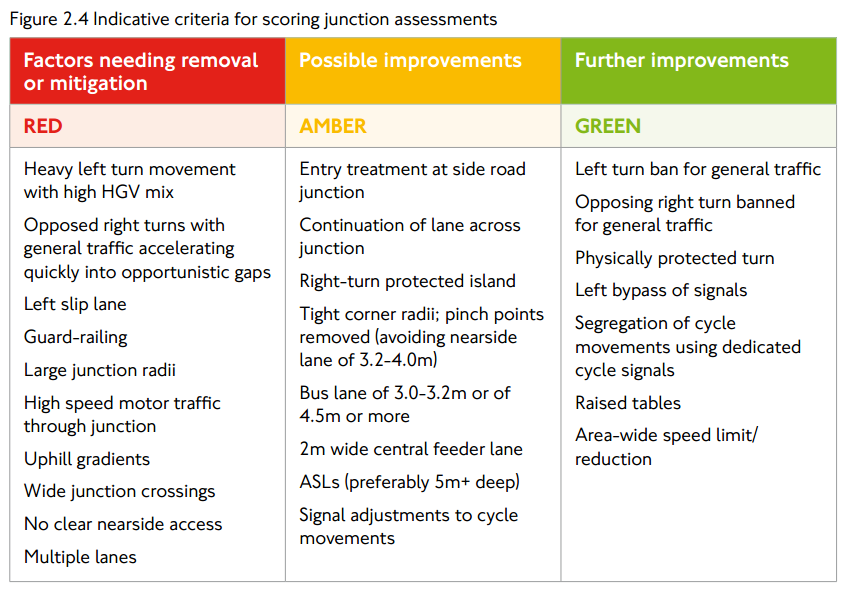
“Without causing undue delays to traffic”, says it all really, happy to do anything, unless it delays traffic, and by traffic, they mean motor traffic. Putting aside the problem with widening the road to ease congestion in the name of bus improvements… I’ve tried to assess this design using the London Cycling Level of Service junction tool (page 14/15) to see what it means for cycling.
Indicative criteria for scoring junction assessments from the London Cycle Design Standards
Every motor traffic movement is signal controlled. There is no protected space for cycling, there are no cycle specific signal stages, and there are no signal controlled pedestrian crossings. Speed limits are 30mph and traffic volumes are about 1,325 motor vehicles per hour (16:00 on Saturday afternoon) on Rutland Road, with higher numbers on Pitsmoor Road.
Rutland Road/Cooks Wood Road T-Junction- Score 0 out of 12
The volume of traffic (at 16:00 on a Saturday) is 1,325 motor vehicles per hour, >1000 vph is the critical failure threshold (at peak, and where cyclists are not separated).
Cooks Wood Road/Rutland Road Junction. All cycle movements are shown and coloured according to their LCDS score.
Travelling from Rutland Road South, there is a 5m deep advanced stop line with a 1.5m cycle lane leading into it, but there’s no cycle infrastructure continuing into the junction. The left turn into Cooks Wood Road isn’t protected at all. Going straight on Rutland Road, the cycle lane doesn’t continue across the junction and there is no protection from left turning traffic (approximately 1/3 of traffic). Both of these movements score 0, but it’s possible that the left turn should score 1.
Travelling from Rutland Road North, there is a 5m deep advanced stop line, but no cycle lane leading into it. There are two lanes, a straight on and a right turn. Going straight on, there are no cycle facilities and there is a pinch point 3.9m wide (width of 3.2-4.0m should be avoided). Turning right cyclists have to move into the outside lane with no protection and then don’t have any protection through the junction and there is oncoming traffic. Both of these movements score zero because of pinch points, speed of traffic, volume of traffic, multiple lanes and oncoming traffic when turning right.
Travelling from Cooks Wood Road there is a 5m deep ASL, with a 1.5m feeder lane, the road has two lanes of traffic, one for left and one for right. Making the left turn, there is no protection from left turning traffic and the ASL feeder lane begins beyond the start of the traffic queue. Turning right, cyclists have to move into the outside lane, there is no protection in the junction and a pinch point of 3.9m on the exit of the junction. Both of these movements score zero.
6 Movements, all scoring 0, out of a total score of 12.
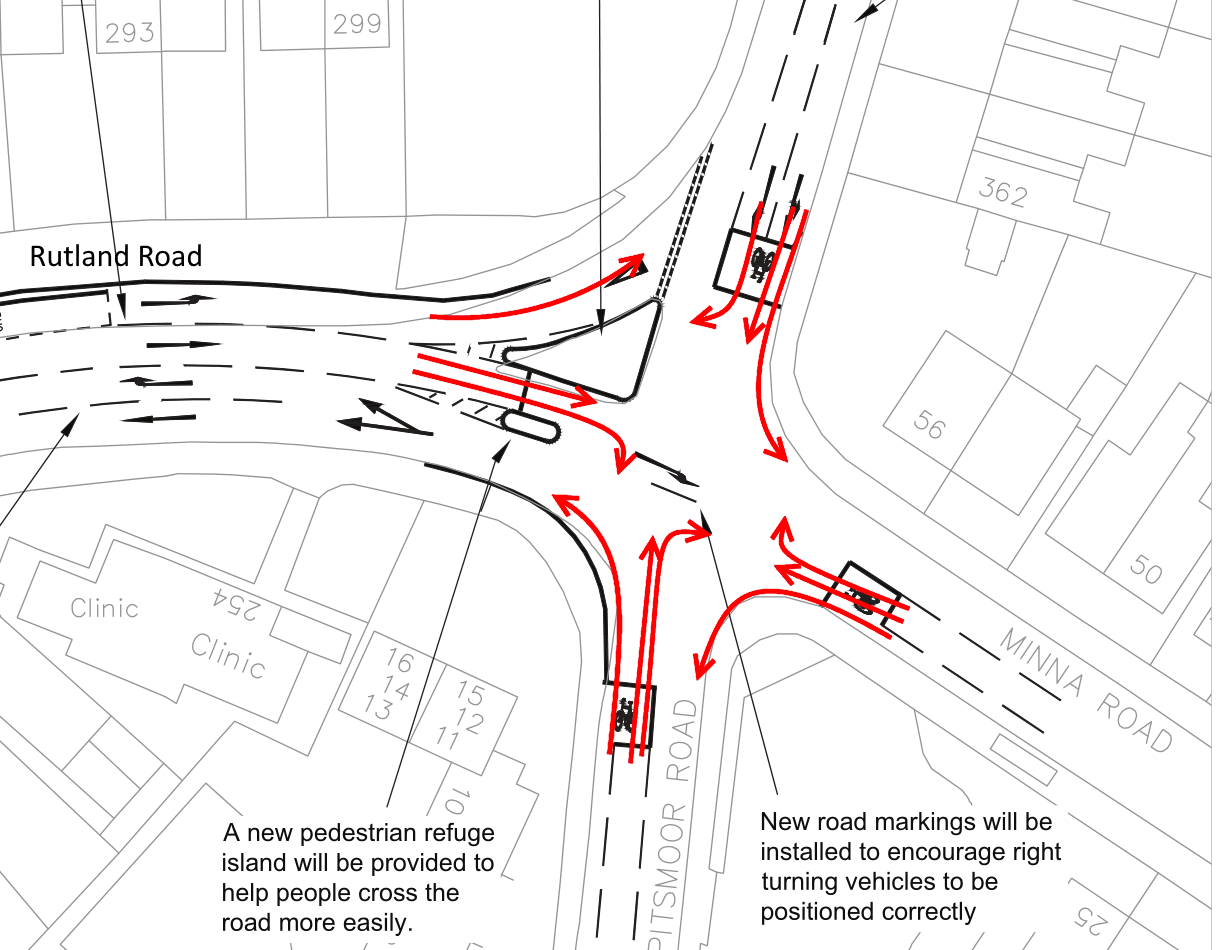
Rutland Road/Pitsmoor Road Crossroads – Score 0 out of 24
Rutland Road / Pitsmoor Road Crossroads. . All cycle movements are shown and coloured according to their LCDS score.
Travelling from Rutland Road, there are two lanes, one left (a sliplane), one combined straight on and right, there is no ASLs and no cycle facilities. All of these movements score zero, left turn because of the left turn slip lane, straight on because of the need to move out into the outside lane to use the junction and because of the lack of separation, and the right turn for the same reason with the added risk of having to sit in the middle of the junction with traffic passing on the left going straight ahead, and oncoming traffic on your right.
Travelling from Pitsmoor Road South, there is a 1.5m wide feeder lane to a 5m deep ASL. There is a single general traffic lane. The speed limit is 30mph and there are > 1000vph, a critical failure. Turning left, the radius is being increased, there’s no dedicated space in the junction for cycling. Going straight on, there is no protection from left turning traffic and there will be conflict with vehicles trying to overtake cycles while oncoming vehicles are waiting to turn right into Rutland Road. There is no dedicated space for cycling in the junction. Turning right, you will have to wait in the middle of the junction with traffic passing on your left, as well as oncoming traffic. All of these movements score zero.
Travelling from Pitsmoor Road North, there is a 5m deep ASL with no cycle lane or feeder lane. The speed limit is 30mph and there are >1000vhp. There are two lanes, a combined straight on and left and a right turn lane. Turning left, there is no dedicated space for cycling, no protection and a large junction radii. Cycling straight on, there is no protection from left turning traffic and no dedicated space for cycling through the junction. Turning right, cyclists need to move into the outside lane and wait in the middle of the junction for a gap. All of these movements score zero.
Travelling from Minna Road from the east, the story is the same. Speed limits are 30mph but I don’t know the volume of the traffic. There is a 5m deep ASL with a 1.5m feeder lane. Turning left, there is no dedicated space for cycling. Going straight on, there is no protection from left turning traffic or dedicated space for cycling. And turning right, there will be a need to wait in the middle of the junction with traffic on both sides. All of these movements score zero.
So, a scheme that scores zero (possibly one) out of 30. Not great. We’ve got to up our game in Sheffield if we’re ever to get to 10% of journeys made by bike in 10 years. Feedback on how I’ve applied the LCDS tool is more than welcome, especially if you think I’ve missed anything or given any movements incorrect scores.


