Categories
Nottingham

Thane Road – Nottingham’s Newest Road

A brand new road on a disused Boots industrial site will enable rat running and has badly designed shared use footways for cycling.
It will open sometime soon in 2020.

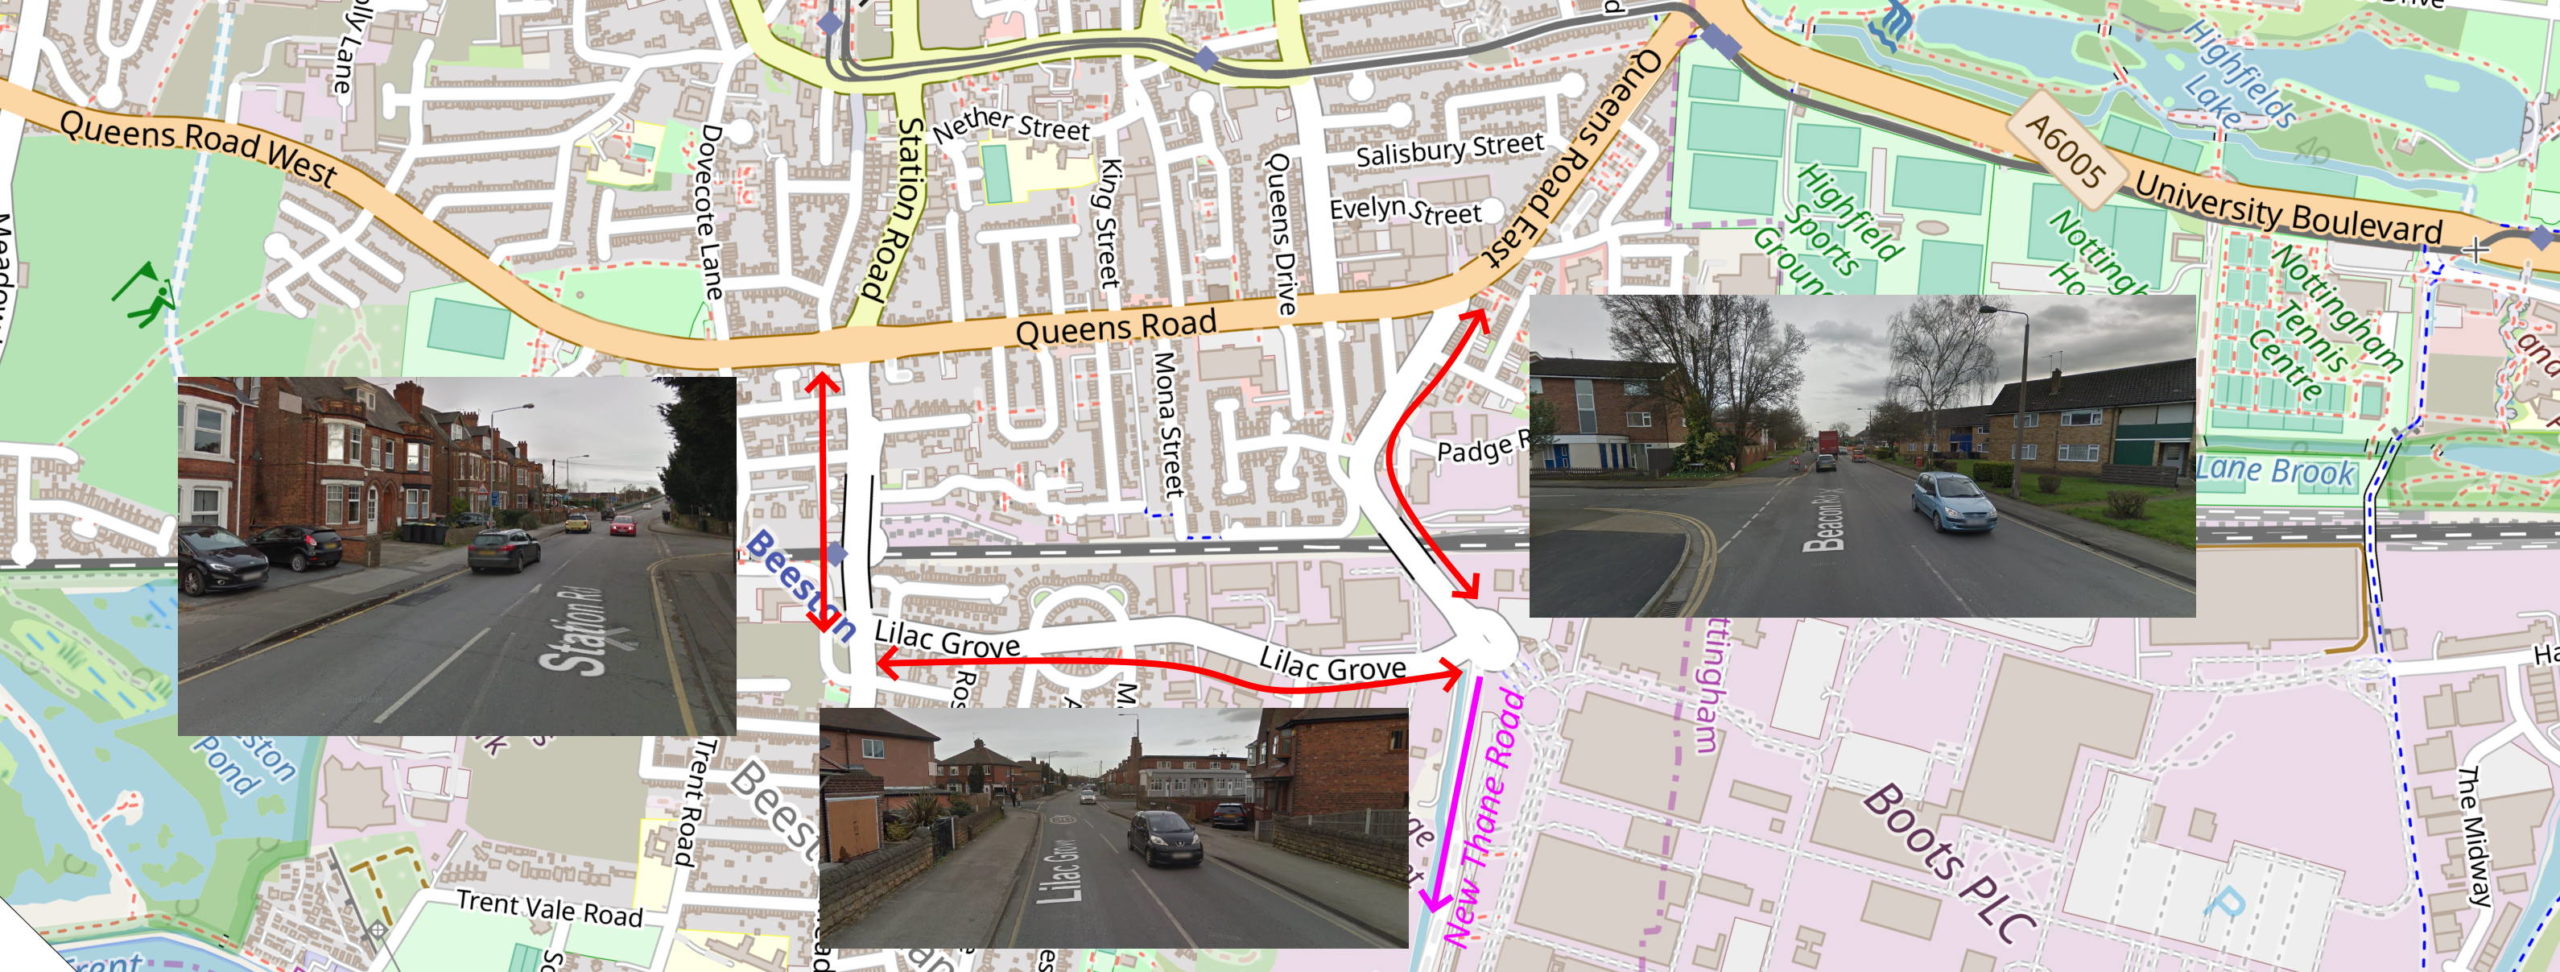
The new road [map] will serve a new residential and commercial business park area.

Regeneration Of Boots Enterprise Zone Masterplan – Thane Road [Original PDF]
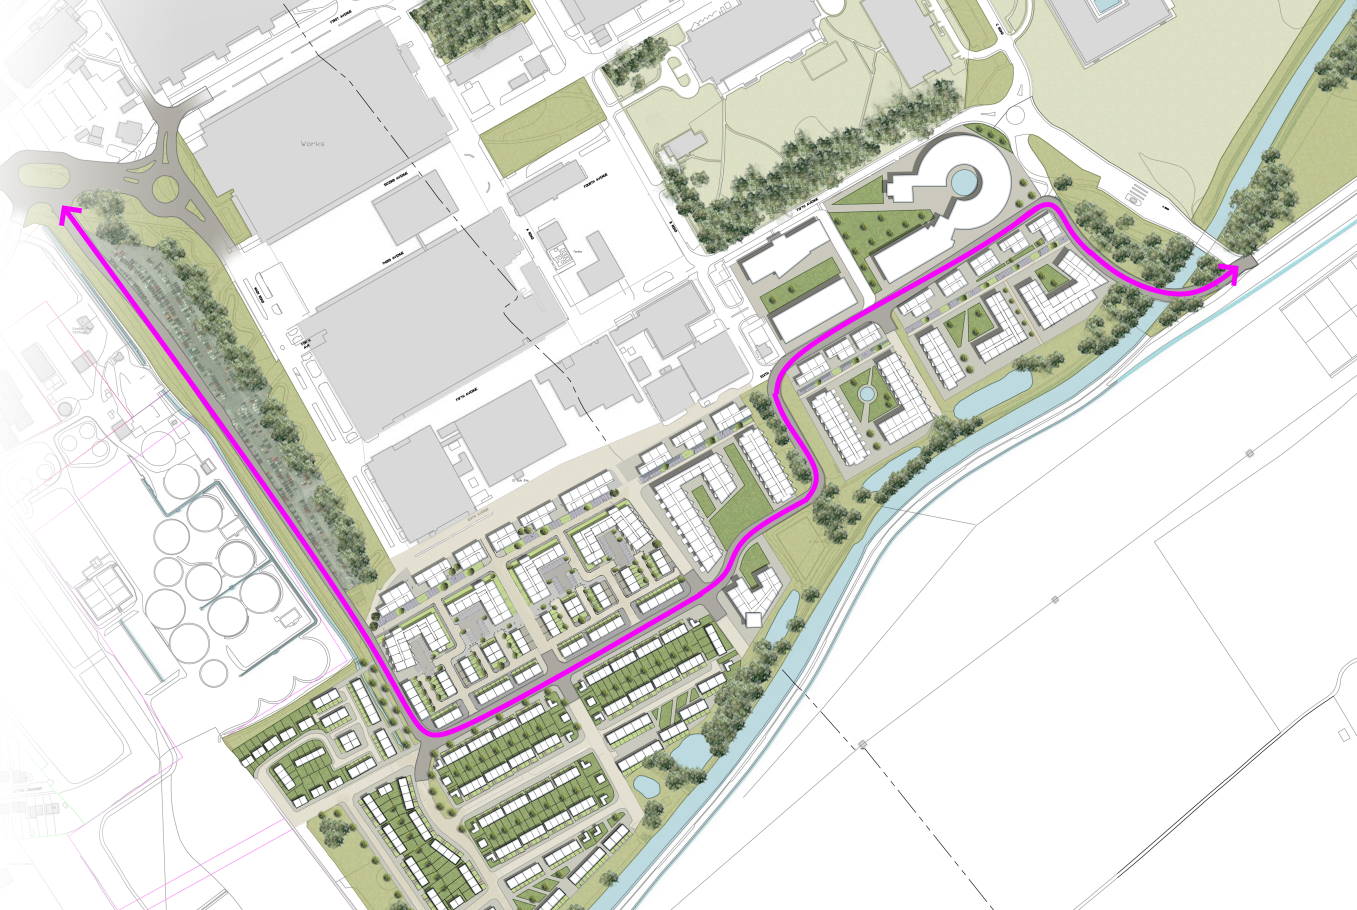
The new road highlighted in pink.

Enabling more rat running in Beeston

This road will create multiple new rat runs in Beeston in Nottingham. Bypassing the main roads, encouraging traffic to use this new bypass, through residential areas.

The New Road, the existing traffic route, and newly created traffic routes.

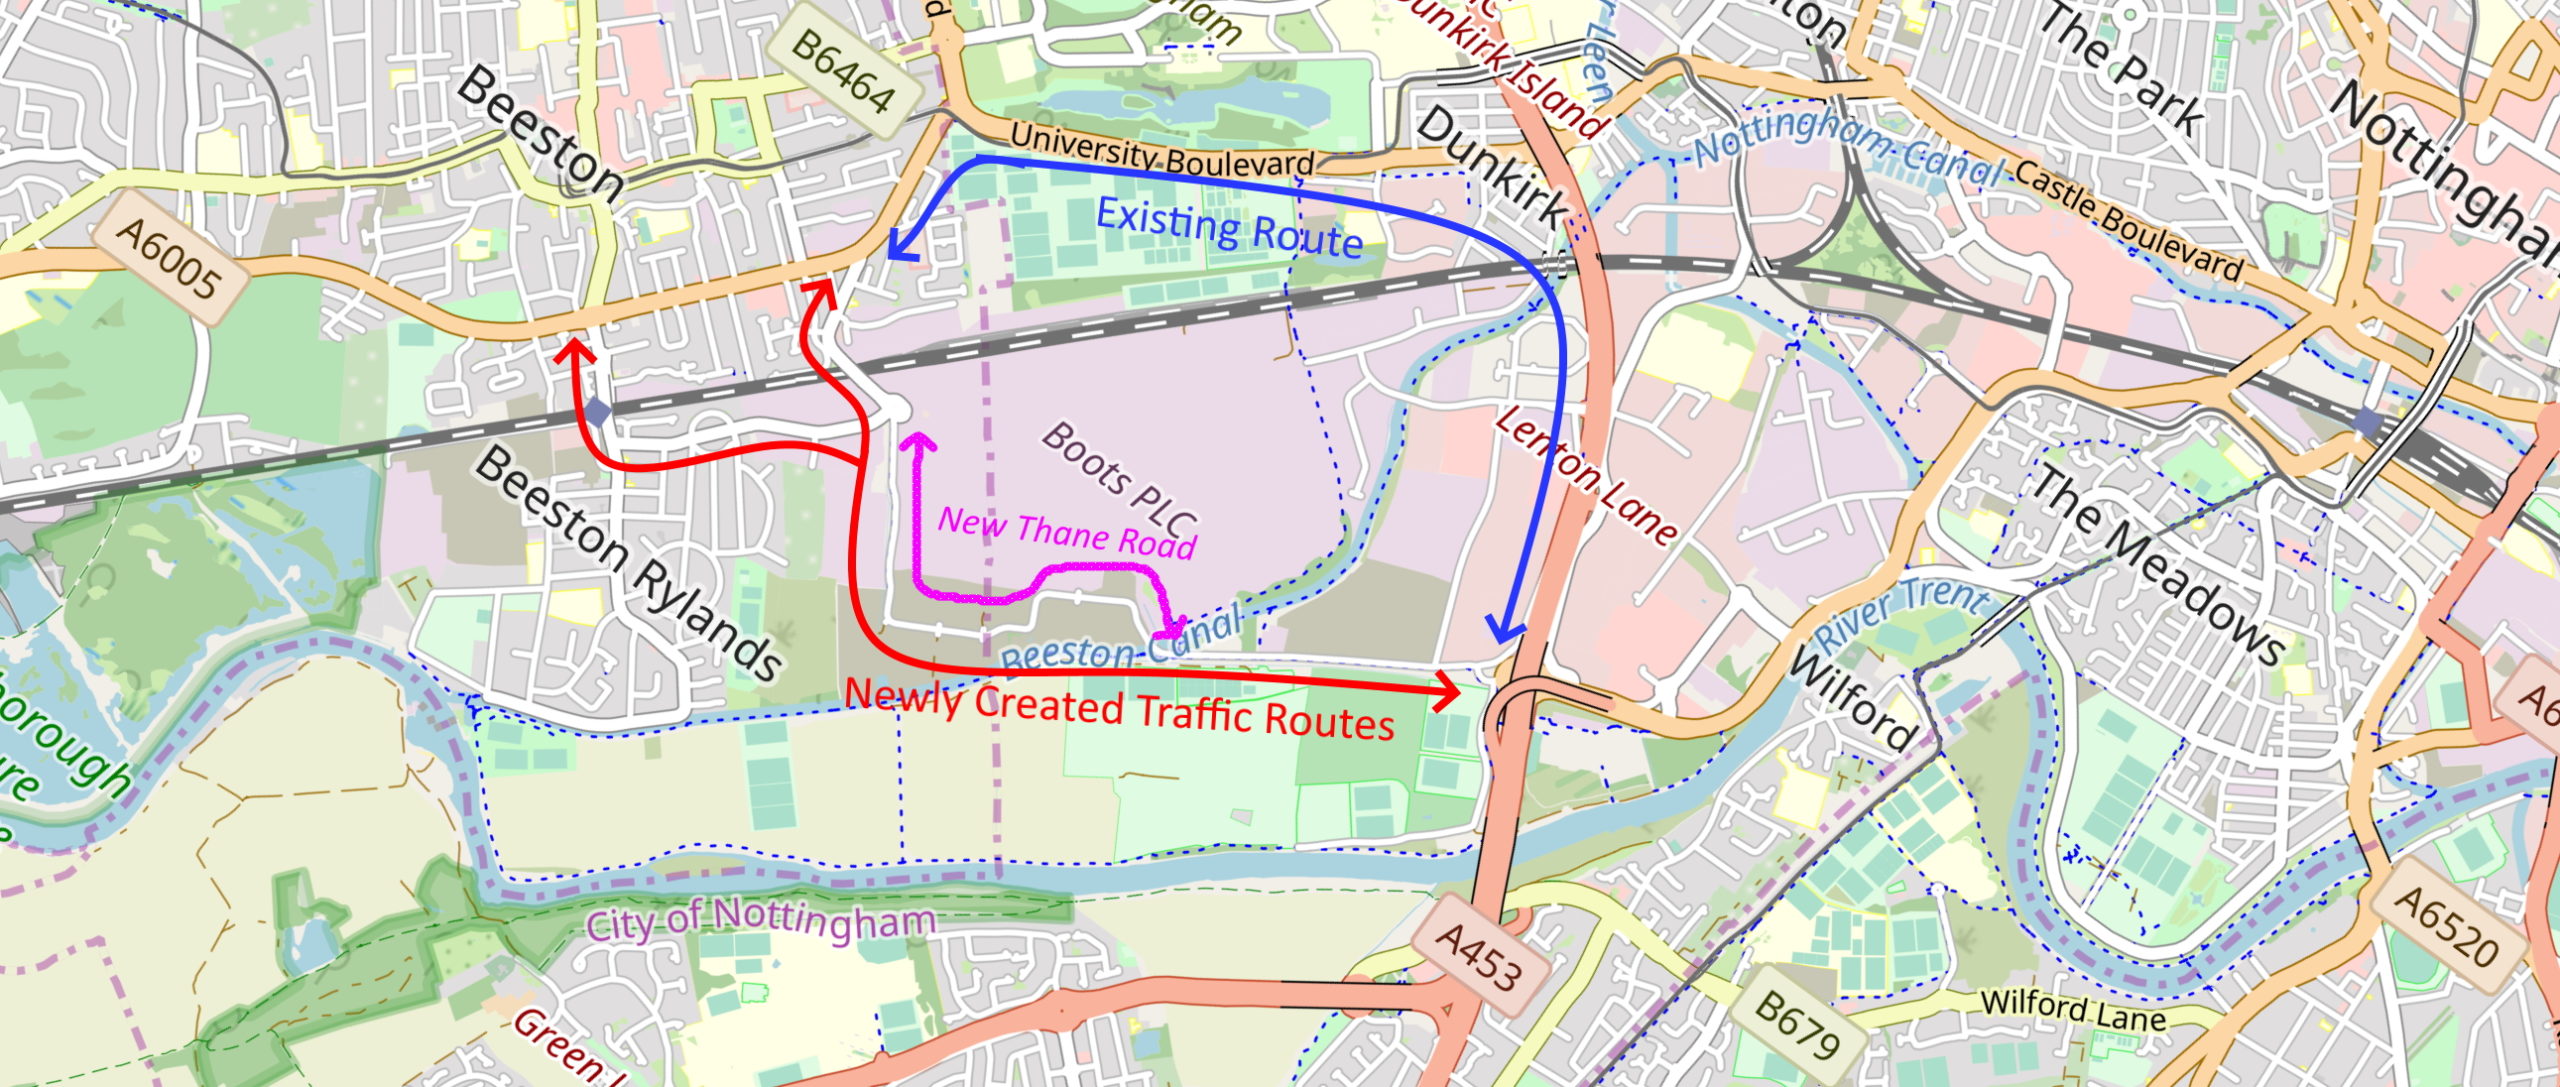
These new traffic routes will enable traffic to drive from the A52 Trunk Road in the East, onto the A6005 Queens Road, and University Boulevard in the West, by opening up access to Humber Road South, Beacon Road, Lilac Grove and Station Road.

Station Road, Lilac Grove, Beacon Road and Humber Road South will all see an increase in traffic because of the new Thane Road

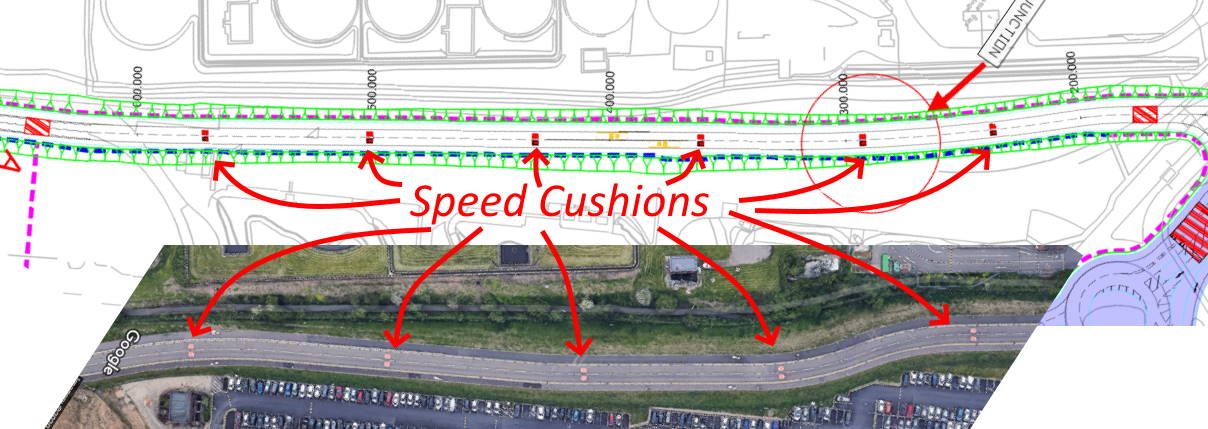
There’s an acknowledgement in the design that speeding traffic will be a problem from the beginning. Speed cushions are part of the design from the outset.

Speed Cushions designed in from the start – An indication that speeding and rat running is acknowledged as a problem from the outset. [Original layout PDF]

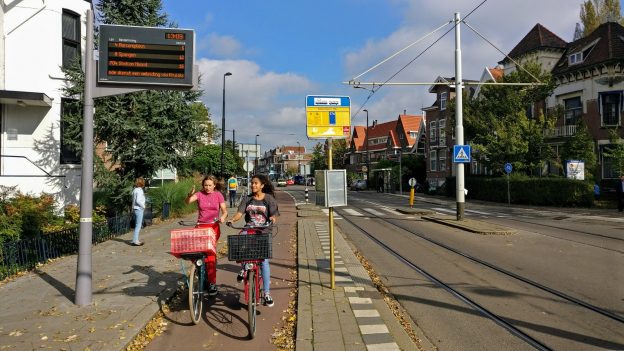
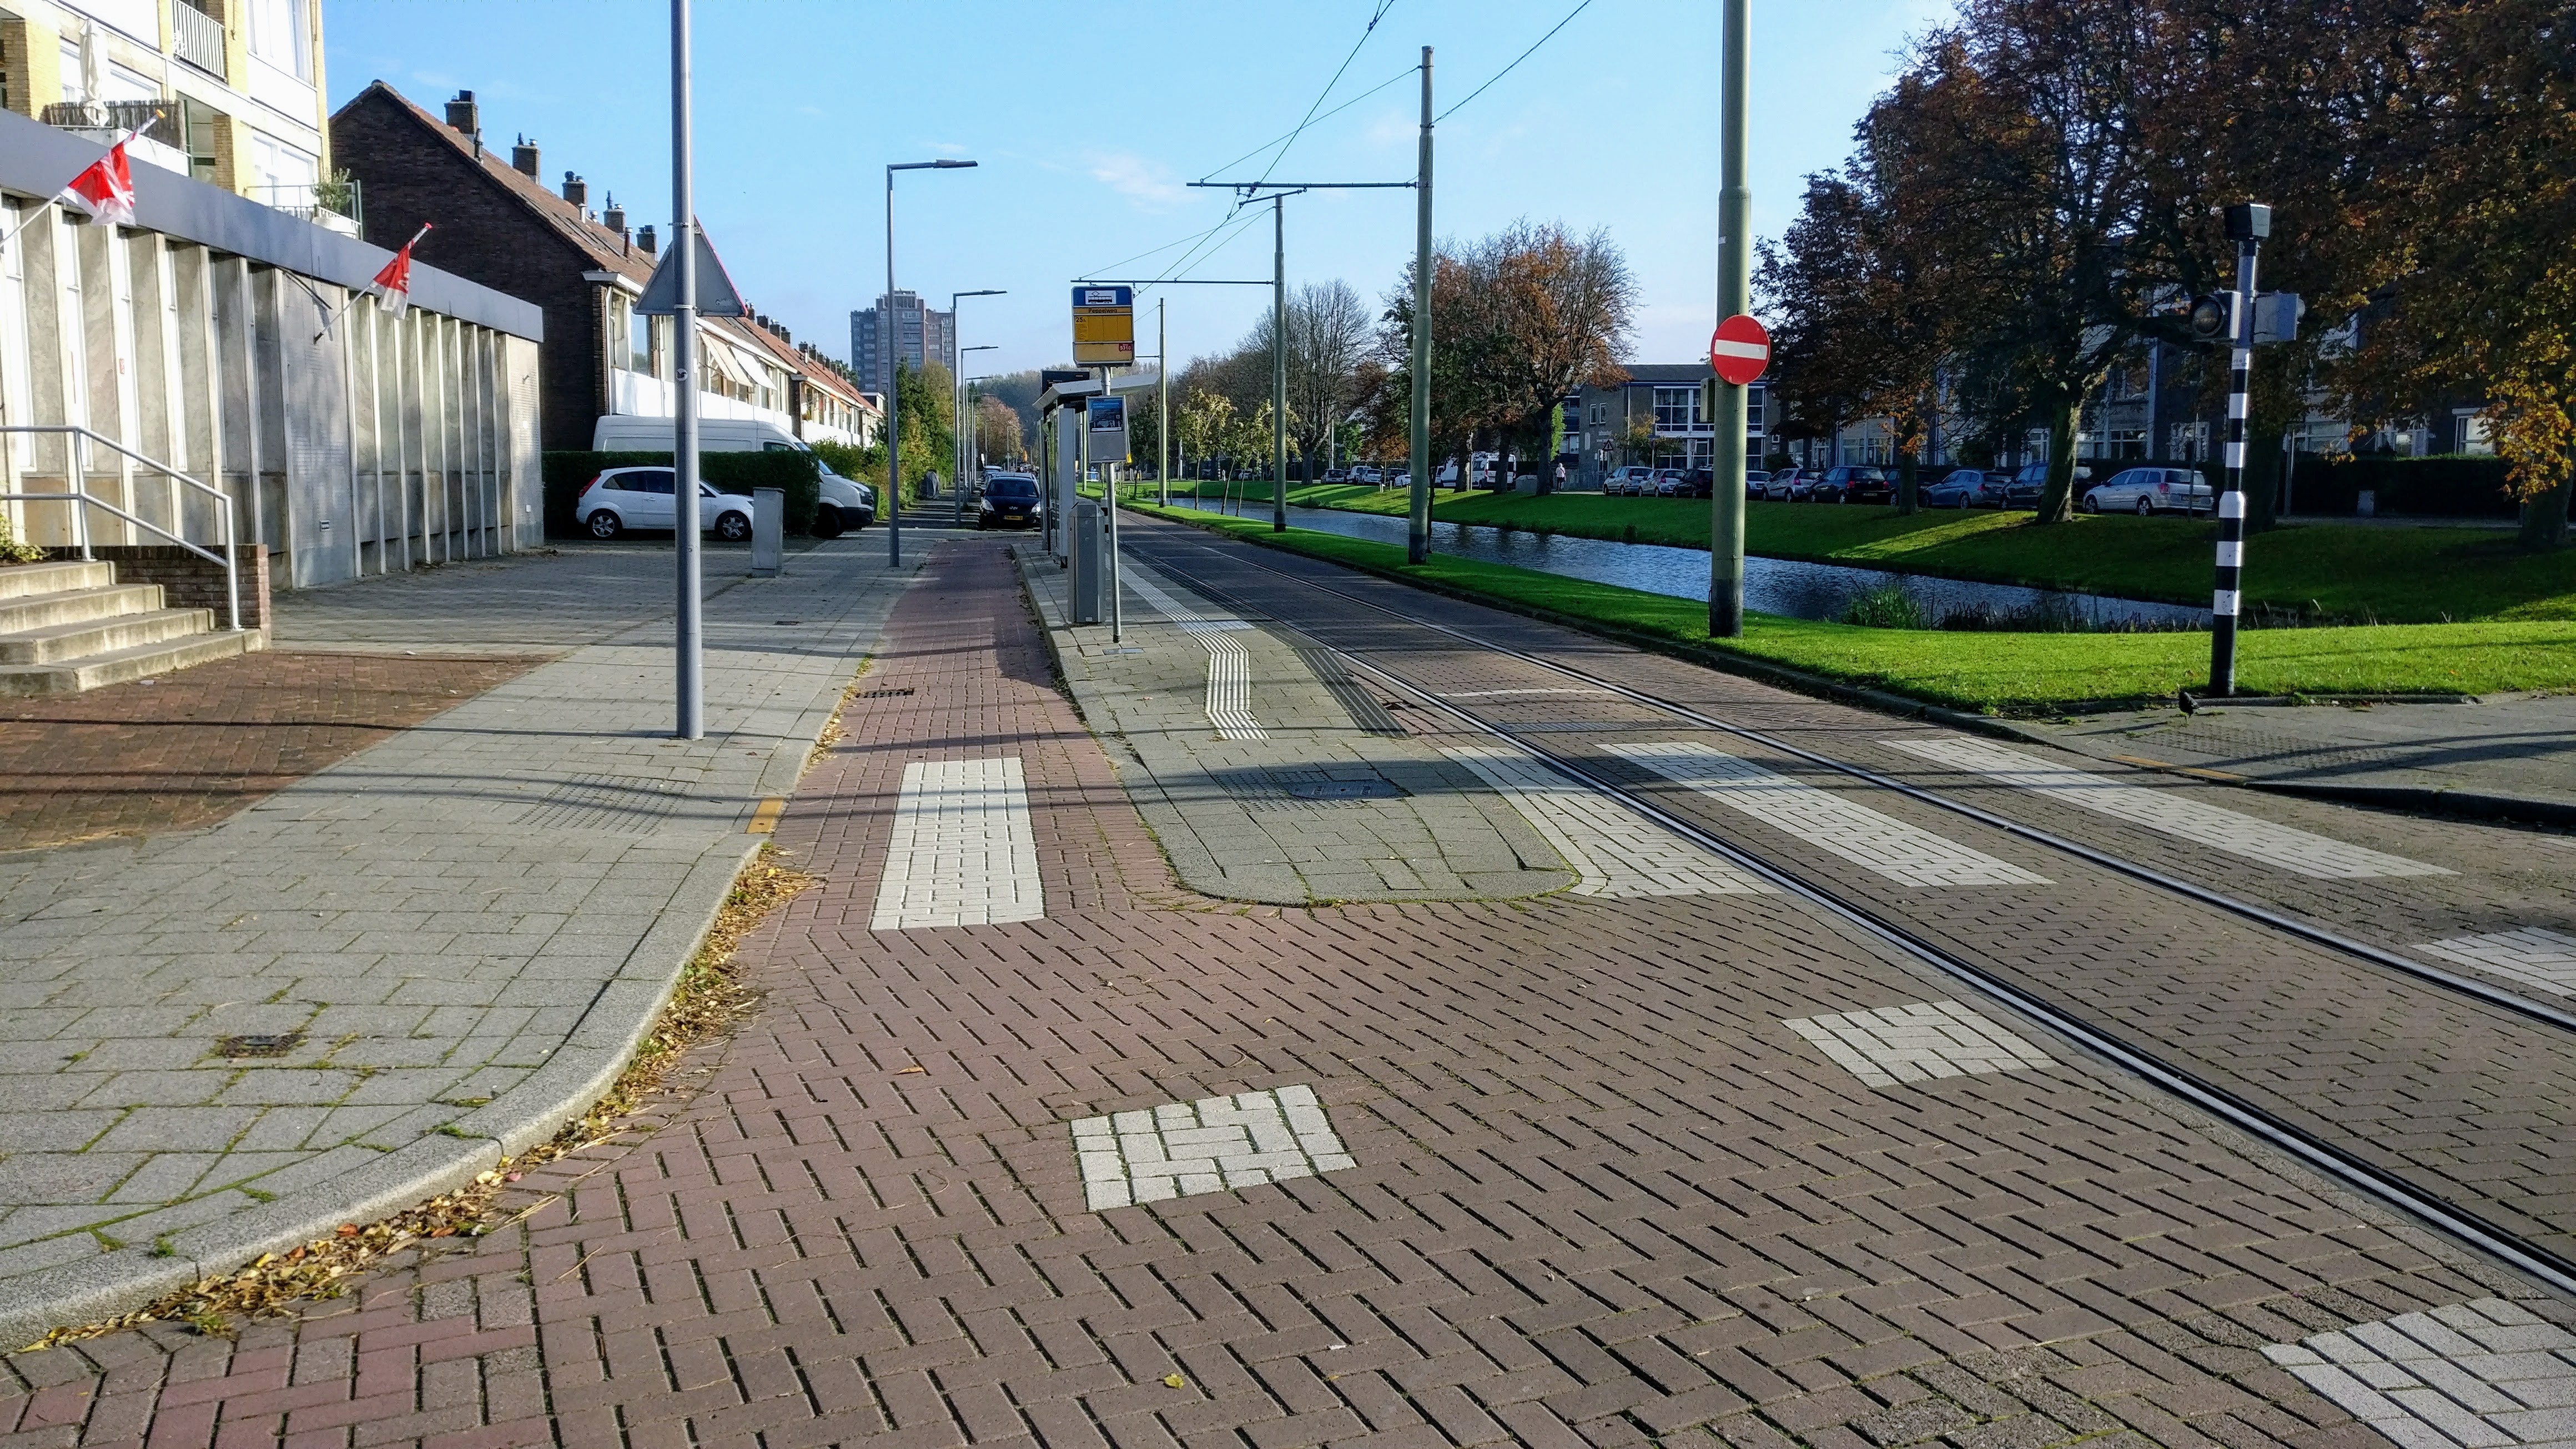
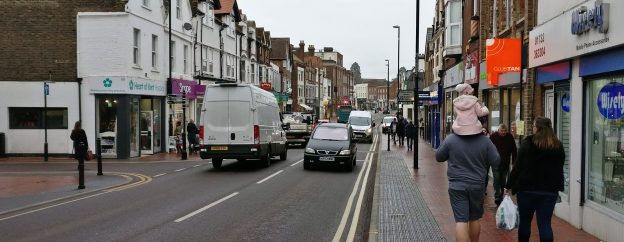
Badly designed shared use footways for cycling

There is an unsegregated shared use footway along the entire new road.

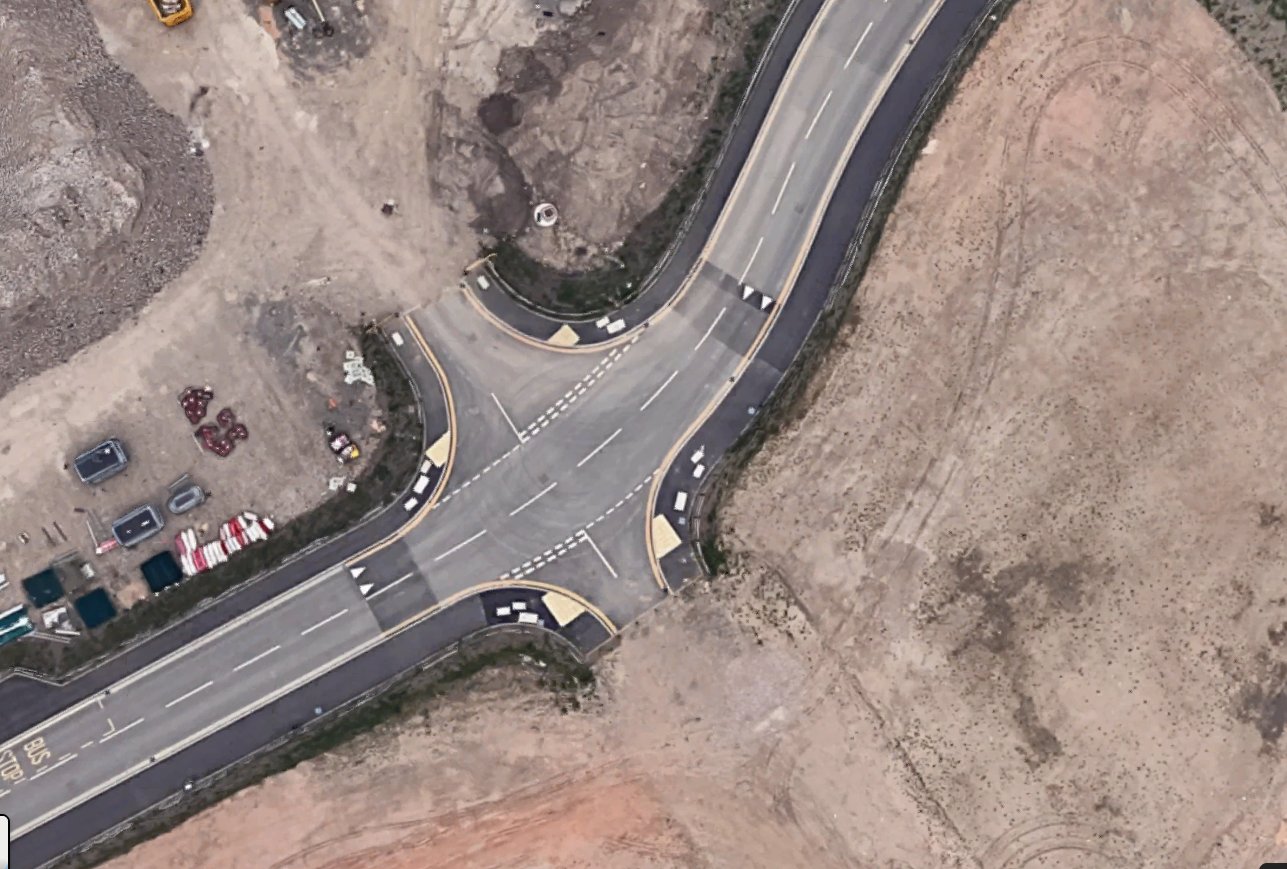
Lazy design. Very little attention has been paid to the junctions which have nice wide radius curves allowing people driving to turn in and out at speed, instead of tight radii.

The footways are discontinuous, people cycling and walking will be expected to give way to vehicles turning in and out.

The Nottingham Cycle Design Guide is reasonably good on this, but has been ignored.

Nottingham Cycling Design Guide – Side Roads
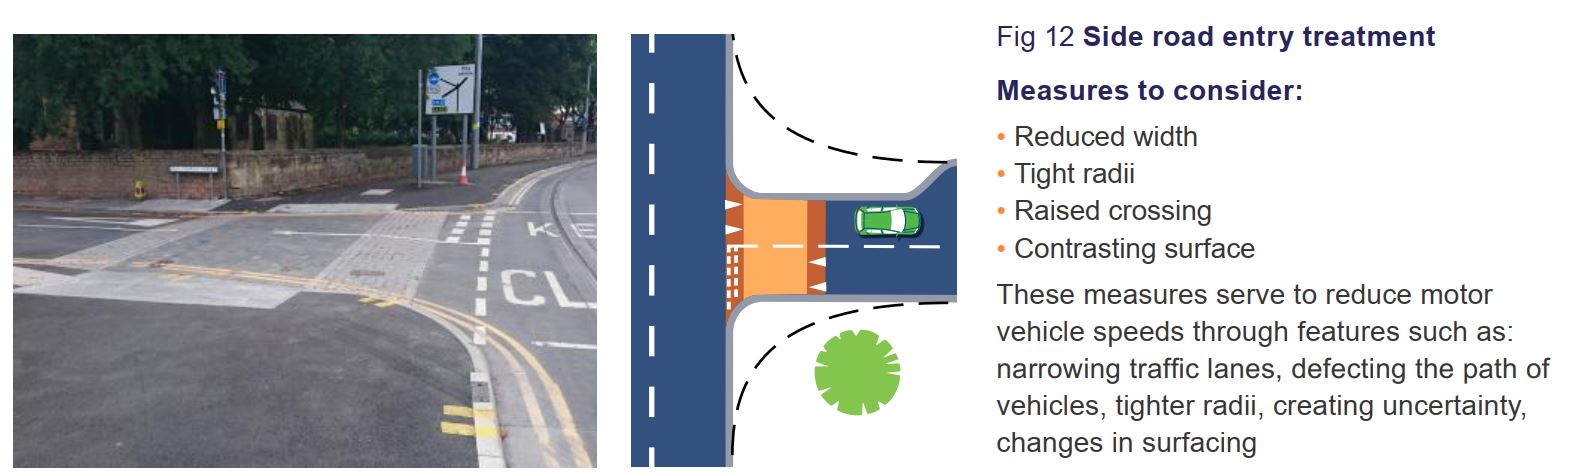
  • Reduced width – Ignored
  • Tight radii – Ignored
  • Raised crossing – Ignored
  • Contrasting surface – Ignored
Nottingham Cycling Design Guide – Side Roads

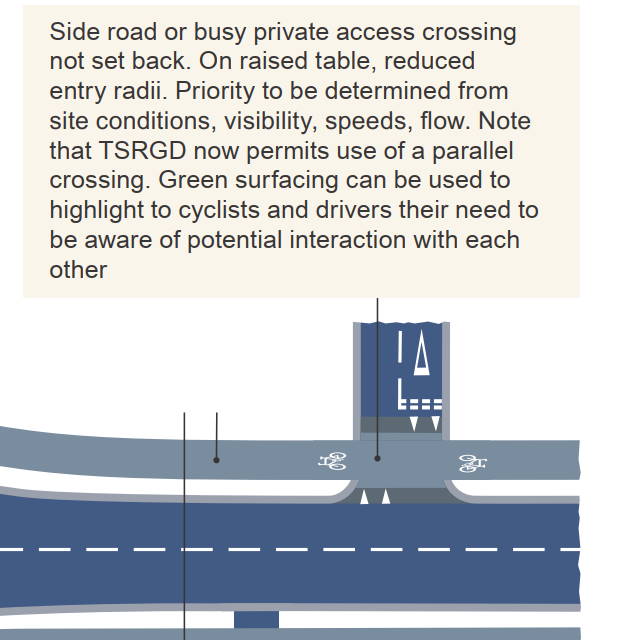
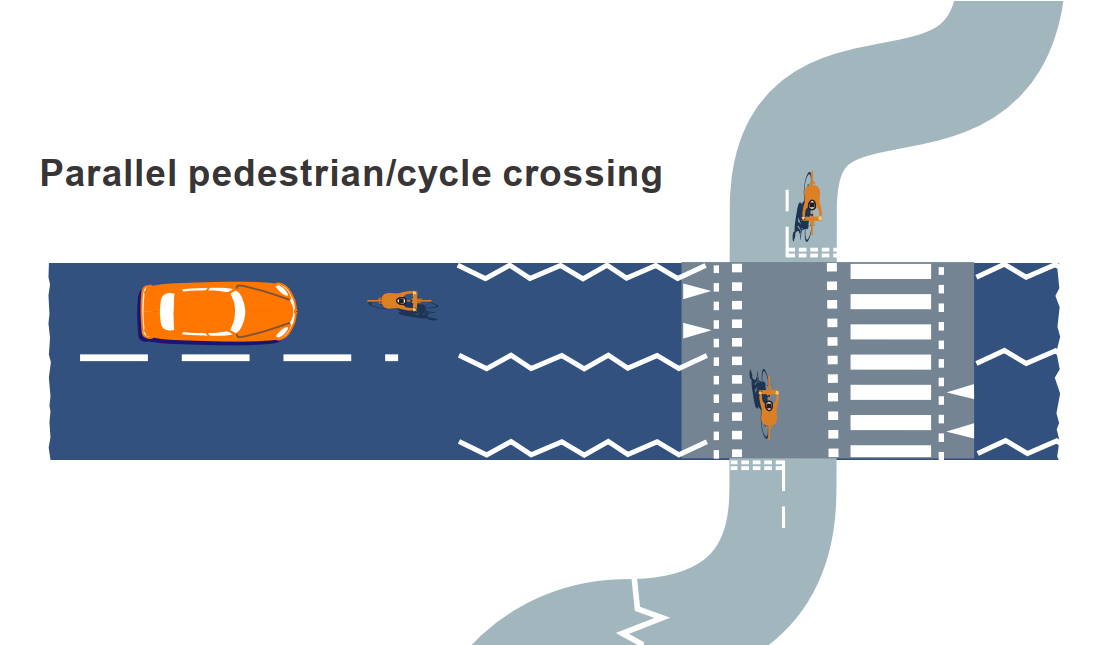
There is a parallel zebra crossing that connects a shared use footway at the top, with a shared use path at the bottom.

Parallel Zebra crossing on Thane Road

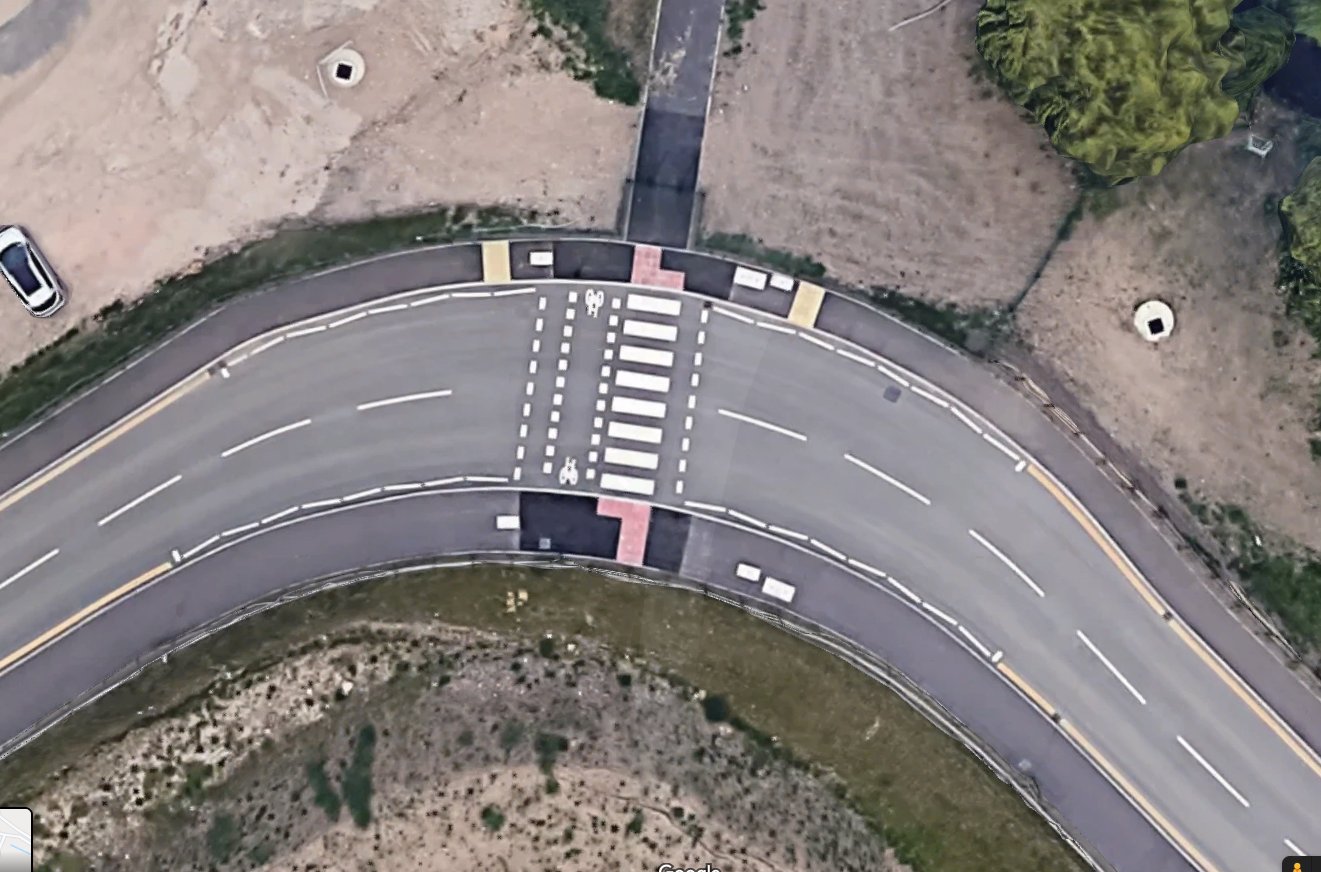
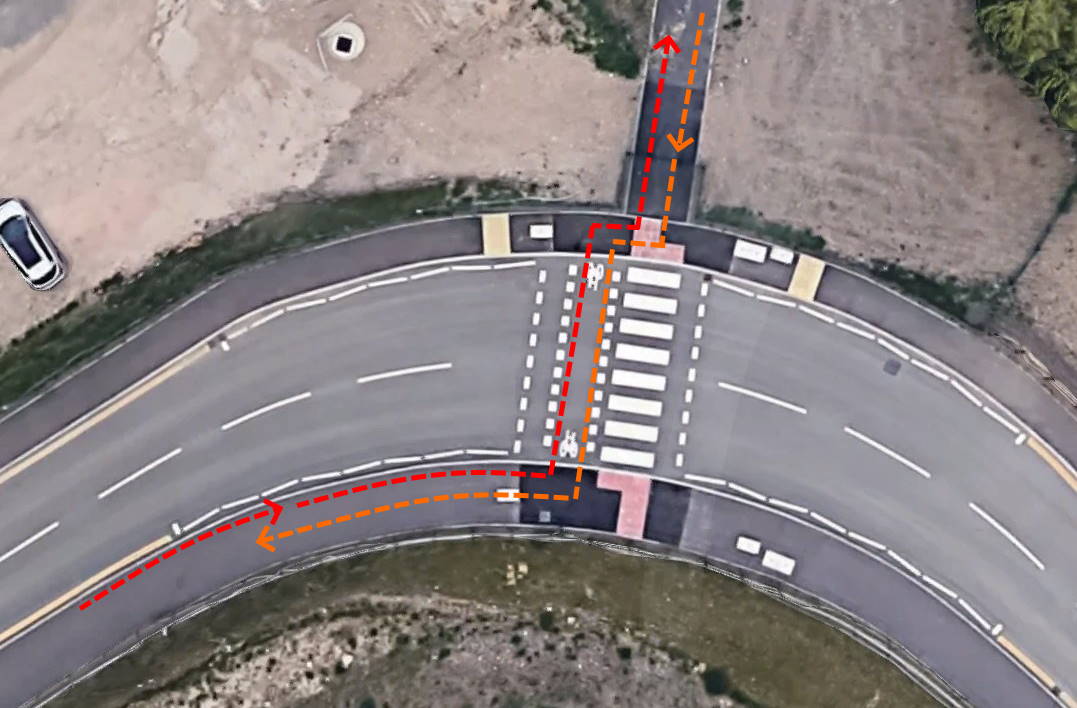
The crossing is on a 90 degree bend – people cycling will have to make difficult turn of head movements to check that it is safe to cross.

The crossing is not on a raised table.

The shared use footway at the bottom requires someone cycling to make a very sharp turn to use the crossing instead of the path being in line with the crossing.

The off road path at the top requires someone cycling to make a series of very sharp turns to use, the paths are designed with sharp corners, instead of smooth curves.

Paralel Zebra, very tight turns required to use, especially if more than one person is using it at once.

Belisha Beacon poles will probably mean that the will be obstacles to avoid when using this crossing and I’m concerned that the while rectangles on the satellite image are electrical/control boxes in the middle of the footway.

Everything in the Nottingham Cycle Design Guide seems to have been ignored.

Nottingham Cycling Design Guide – Parallel crossings

Conclusion

This is a brand new road, on an empty site.
The designers have chosen outdated designs straight out of the 70s. Cycling is an afterthought, permitted on poorly designed footways.
New rat run routes are enabled.

This new road shows that Nottingham still has a long way to go.

Categories
air quality

Widen roads to reduce vehicle emissions? Really?

Sheffield City Council Business Case, 2018 [Link]
Sheffield City Council Funding Bid, 2017 [Link]

We often hear these claims, but very rarely are they backed up by evidence. Normally they’re just stated, like in the two examples above. I went looking for the evidence and this is what I found.

The basic premise is that vehicles speeding up and slowing down produces more emissions than vehicles travelling at a constant speed (smoother traffic flow), that it will take each vehicle longer to travel through an area, therefore increased emissions. This argument is used to argue against speed bumps, traffic lights, lower speed limits and 20mph zones, and is used in favour of schemes to reduce congestion.

However the counter argument is that decreasing congestion by increasing road and junction capacity (to reduce delay and queuing) will increase traffic levels through a process known as induced travel, or latent demand (the idea that people choose a different route, mode or time to make trips because of congestion).

So, there’s a trade off, it’s likely that early results will show an improvement in air quality, but changes in travel patterns over time will lead to an increase emissions in the medium term. For more information about induced traffic see WikipediaCampaign for Better TransportWired.

Bigazzi, Alexander York, "Trafc Congestion Mitigation as an Emissions Reduction Strategy" (2011). Dissertations and Teses. Paper 131. 10.15760/etd.131
Bigazzi, Alexander York, “Trafc Congestion Mitigation as an Emissions Reduction Strategy” (2011). Dissertations and Teses. Paper 131. 10.15760/etd.131

Studies that assume that the number of journeys are fixed, will not include the possibility that pollution will increase due to increased trips.

If you’re looking at a scheme where it’s claimed air quality will be improved, always check if the study assumed that the number of trips is fixed and won’t change.

I don’t know how common this claim is around the UK/World, but in Sheffield I’ve read it a number of times. For example, the 2017 A61 Inner Ring Road scheme will “reduce congestion which will improve air quality”.

There is academic research in this area, some of which involves micro-simulation of vehicle movements. There are 2 studies from 2003 and 2006 with the same author, the first looked at 2 merging roads and traffic signal synchronisation, and the second paper looked at a motorway merge.

In summary, the studies found 10 to 30% reduction in pollutants if traffic levels remained the same, but that pollution would be increased if traffic levels increased by 15 to 30% (depending on the scenario modelled).


The key research is:

R.B. Noland, M.A. Quddus / Transportation Research Part D 11 (2006) 1–14, “Flow improvements and vehicle emissions: Effects of trip generation and emission control technology” [Link]

Fotis Stathopoulos and Robert Noland, Issue. 1842, : Pages. 57-63
(Issue publication date: January 2003) /Transportation Research Record: Journal of the Transportation Research Board / “Induced Travel and Emissions from Traffic Flow Improvement Projects” [Link]

The research in this area was summarised in 2011 in a masters thesis and is well worth a read.

Bigazzi, Alexander York, “Traffic Congestion Mitigation as an Emissions Reduction Strategy” (2011). Dissertations and Theses. Paper 131. [Link]

Categories
tram

Cycling around Rotterdam trams and tram tracks – A photo tour

I spent a few weeks in Rotterdam last year and explored the tram lines end to end looking to see how they’d designed the infrastructure to support cycling. I saw a whole range, from really good to really bad. Here are selection of photo’s that illustrate the range of conditions.

There is a Google Photos album with all these in here.

Peppelweg

Peppelweg - Tram stop bypass
Peppelweg – Tram stop bypass

Peppelweg - Tram stop bypass
Peppelweg – Tram stop bypass

Peppelweg - Tram stop bypass
Peppelweg – Tram stop bypass

Categories
council elections

Deprivation Levels and Councillor Candidates in the Sheffield May 2016 Election

In Sheffield, 23% of people live in the most 10% deprived areas in the country, but only 13% of councillor candidates came from those areas.

In Sheffield 9% of people live in the least 10% deprived areas in the country, but 27% of Lib Dem candidates, and 31% of Conservative party candidates came from those areas.

The full data is presented in the charts below. The data is from the 2015 Indices of Multiple Deprivation, the Sheffield City Council Statement of Persons Nominated May 2016, and Annual Mid-Year Population Estimates for the UK, for more information see my other blog post.

Sheffield candidates for May 2016 election – By deprivation level

Categories
elections

How many of Sheffield’s councillor candidates live in the ward in which they’re standing?

If you’re one of the 21,000 people who live in Firth Park Ward, then in the May 2016 Sheffield Council election, 13 of the 14 candidates you could vote for lived outside your ward.

However, in a different part of the city, 71% of East Ecclesfield’s candidates lived within the ward.

Across Sheffield the picture is varied, of the 372 candidates in 28 wards, 36% lived in the ward in which they were standing, 64% did not.

In this post I’m going to look at the candidates in the 2016 Sheffield Council election and try to explore some interesting information about the people who stand for election as local councillors. I’m not making any judgements about the results of this information, but I do think it’s interesting to see the disparity across different areas of the city and between the political parties.

The data is from the ‘Sheffield City Council Statement of Persons Nominated May 2016‘, the maps were created using QGIS, maps for all wards are at the bottom of this post and in this Google Drive folder, I hope to make the source data available online soon.

Categories
Uncategorized

Sheffield City Council spending data

Update 6th Feb 2018: The data for the missing months is now available and has been incorporated into the linked Google Fusion sheet.

The law says that local government should publish a list of payments to suppliers over £500 (and recommends publishing payments over £250). I remember looking at Sheffield’s data some time ago and giving up because the quality was so poor. Well, this time I’ve persevered and I’ve published a much more usable data set.

An example of how this data could be useful, it’s possible to check to see how much money Sheffield Council has paid to Carillion, what is was for, and verify their statement that all the council contracts with Carillion are complete.

Payments to Carillion by Sheffield City Council – All payments over £250
(Some data missing)

Much of the data is missing, and much of it is inconsistently formatted (notably dates, which are in any format from Excel integers, to mm/dd/yy hh:mm:ss to d/m/yy), this makes it REALLY difficult to use the data without investing a significant amount of time.

At the moment, the data for the following months is missing Nov-15, Apr-16, Jul-16, Aug-16, Oct-16, Dec-16, Feb-17, Apr-17, May-17, Jul-17, Aug-17, Sep-17, Oct-17, Nov-17, Dec-17.

I’ve gone through the data, cleaned it up, and combined all the monthly files into one.

The scripts I used are in this GIT repository.

The final data is published in this Google Fusion Sheet and can be downloaded as a spreadsheet easily.

A quick summary of the data as it stands

Monthly value of payments made by Sheffield City Council over £250
You can see that a considerable amount of recent data is missing

Largest suppliers to Sheffield City Council – All payments over £250
Some data is missing


Categories
Uncategorized

No more Sheffield Highways Cabinet Member Decision Sessions. No more Sheffield City Region Transport Committee.

Sheffield City Council Highways Cabinet Member Decision Session

A little while ago, the Sheffield City Council Highways Cabinet Member Decision Session meetings were cancelled. This wasn’t announced, the final meeting didn’t include any mention that there would be no more, just cancelled.

When a friend wondered when the next one would be, he was told.

Highway Cabinet Member Decision Sessions will no longer meet at the request of the Cabinet Member. Decisions will be taken by the Individual Cabinet Member as previously and future decisions will be advertised here http://democracy.sheffield.gov.uk/mgListPlans.aspx?RPId=123&RD=0

Representations on any issue can be made direct to the Cabinet Member who is Councillor Jack Scott who can be contacted as outlined here http://democracy.sheffield.gov.uk/mgUserInfo.aspx?UID=123


The Sheffield council meetings provided significant information about the decision making process about transport decisions in the city, and the opportunity for members of the public and media to listen to council officers explain their proposals, read the reports(which I think will still be available), ask questions at the meeting and see decisions being made. Now, the decisions are put on a list on the website, no meeting, no discussion (unless in private, “Representations on any issue can be made direct to the Cabinet Member”).
Sheffield City Region Combined Authority Transport Committee

Now, it turns out that the Sheffield City Region (Combined Authority) Transport Committee has been cancelled too. This is the body who are in charge of HUGE devolution transport spend.

When asked, the authority said:

The Combined Authority is currently reviewing its Governance arrangements and this includes the Transport element of its remit. All transport related issues which require necessary approvals will be considered through the Combined Authority until such time these new arrangements are adopted.

This is the organisation who’ve been given control over very significant amounts of devolution investment and they are the recipients of the Integrated Transport Block funding for the whole of South Yorkshire. The final meeting (in May) didn’t discuss that there would be no more meetings. The subsequent full Combined Authority meetings (June and July) haven’t had any items regarding transport that would normally be discussed at the Transport Committee, no transport project programme updates and no budget/spend monitoring. I also can’t find and mention of the Transport Committee being cancelled in any minutes or agendas anywhere.

What’s going on!?

Categories
Uncategorized

Byelaws and fining people for leaving vehicle engines running unnecessarily

Sheffield City Council has a consultation open at the moment about giving fines to people who leave vehicle engines running when not driving (idling). I fully support this, and everyone should respond positively to the consultation.

However, I’m confused about one aspect of the consultation, byelaws.

This consultation asks your views on whether Sheffield City Council should introduce and enforce new byelaws … for “no vehicle idling”

…if Sheffield City Council were to undertake enforcement and issue fines we would need to progress a local byelaw

Does Sheffield City Council need a byelaw to give fines to people who leave engines idling? I don’t think so.

The example used in the consultation is Westminster, where they recently passed an Experimental Traffic Regulation Order to enforce this.

The Order will prohibit engine idling by waiting vehicles, with certain exceptions, to facilitate civil enforcement of the contravention

Not a byelaw, but an experimental traffic regulation order. It’s not clear to me exactly how this offence can be enforced by a TRO, I can’t figure out the relevent laws, they’re too confusing. However, sometimes, traffic enforcement in London is very different to the rest of the country and the laws are different. I’ve emailed Westminster to ask but haven’t heard back.

Elsewhere (and in London?) the The Road Traffic (Vehicle Emissions) (Fixed Penalty) (England) Regulations 2002, and before that, the The Road Traffic (Vehicle Emissions) (Fixed Penalty) Regulations 1997 could be used. To do that, the local authority has to apply for permission, train some people, and they’re good to go. No TRO, no byelaw, that’s it.

Examples of authorities who’ve done this include, OldhamIslington(2006), Brent(2006), Reading(2016), Kensington & Chelsea (2005), Winchester (2004), North Lincolnshire (2009), and Westminster (2015, before the recent TRO).

So, where did the idea of a byelaw come from? I suspect directly from recent NICE guidelines.

Consider taking action to reduce emissions within the clean air zone. For instance: Introducing fuel-efficient driving initiatives including: Bylaws and other action to support ‘no vehicle idling’ areas

Where did NICE they get this idea that byelaws are required to enforce this in England? I don’t know!

Looking at the DCLG advice for creating byelaws, I don’t believe that a byelaw is allowed to be created for this purpose. They’re very clear that

A byelaw cannot be made where alternative legislative measures already exist that could be used to address the problem.

So, what’s going on? Is this just a case of sloppy terminology in the consultation? Or a more fundamental misunderstand of the law?

I hope Sheffield Council don’t try to create a byelaw covering engine idling. I don’t think it would be legal given other powers they already have and it’s a long, arduous (and probably expensive) process to create new ones. 

Sheffield Council should apply to the Secretary of State for Transport (as other local authorities have done), and start enforcing this law ASAP. Nice and simple. No byelaw needed.

Categories
Uncategorized

Sheffield still keeping consultations hidden, under wraps, and suppressing responses – Adding pedestrian crossing phases to a crossroads

I’ve written before about consultations in Sheffield, how they’re not advertised, hidden away, and hard to respond to. This is another example. This time it’s about a new pedestrian crossing in Crookesmoor at the junction of Barber Road, Crookes Valley Road and Crookesmoor Road (map).

Consultation about a new crossing at Barber Road / Crookes Valley Road / Crookesmoor Road in Sheffield

If you think pedestrian crossings and cycle lanes are a good thing, or a bad thing, then you can reply to the consultation, if you receive this letter.

If you search for it in the press, you won’t find anything.

If you search for it on the council’s website, you won’t find anything.

If you search for it on the council’s consultation portal, you won’t find anything.

You have to be on a special email list, or live on one of the houses near the junction to hear about this, then you’ll get a letter.

This was the very first thing I ever contacted Sheffield council about, 9 years ago, in 2008. I crossed this junction daily on foot, I was fed up with there only being traffic lights for cars and no pedestrian crossing phases. I would want to know about this consultation, I would want to reply to it in support, but the only way I know about it was because CycleSheffield are on one of those email lists and wrote about it on their Facebook page.

Why is everything so hard in Sheffield?

Categories
Uncategorized

A traffic count on Tonbridge High Street, 13,600 vehicles per day

Tonbridge High Street 1st March 2017

I did a quick traffic count on Tonbridge High Street a few days ago.

It showed that at about 17:00, there are about 1,360 motor vehicles per hour using the road.

Using the rule of thumb, 10x hourly peak traffic = day traffic, that gives 13,600 motor vehicles a day using Tonbridge High Street.

Putting this into perspective for cycling,

  • London Cycle Design Standards give a critical failure to any street where total volume of motor traffic is > 1,000 vehicles/hour at peak and cyclists are not separated. Green is <200 vehicles per hour at peak.
  • The Welsh Active Travel Guidance gives a critical failure to any street where total volume of traffic is > 10,000 vehicles per day, and cyclists are not separated. Green, is 2,500 vehicles per day.
  • The UK LTN2/08 says that for > 10,000 vehicles per day, cycle lanes or tracks are required.

So, Tonbridge High Street is not a place where many people would find it comfortable to cycle.

(My data is available here – Tonbridge High Street Traffic Count 1st March 2017)