Categories
council elections

Deprivation Levels and Councillor Candidates in the Sheffield May 2016 Election

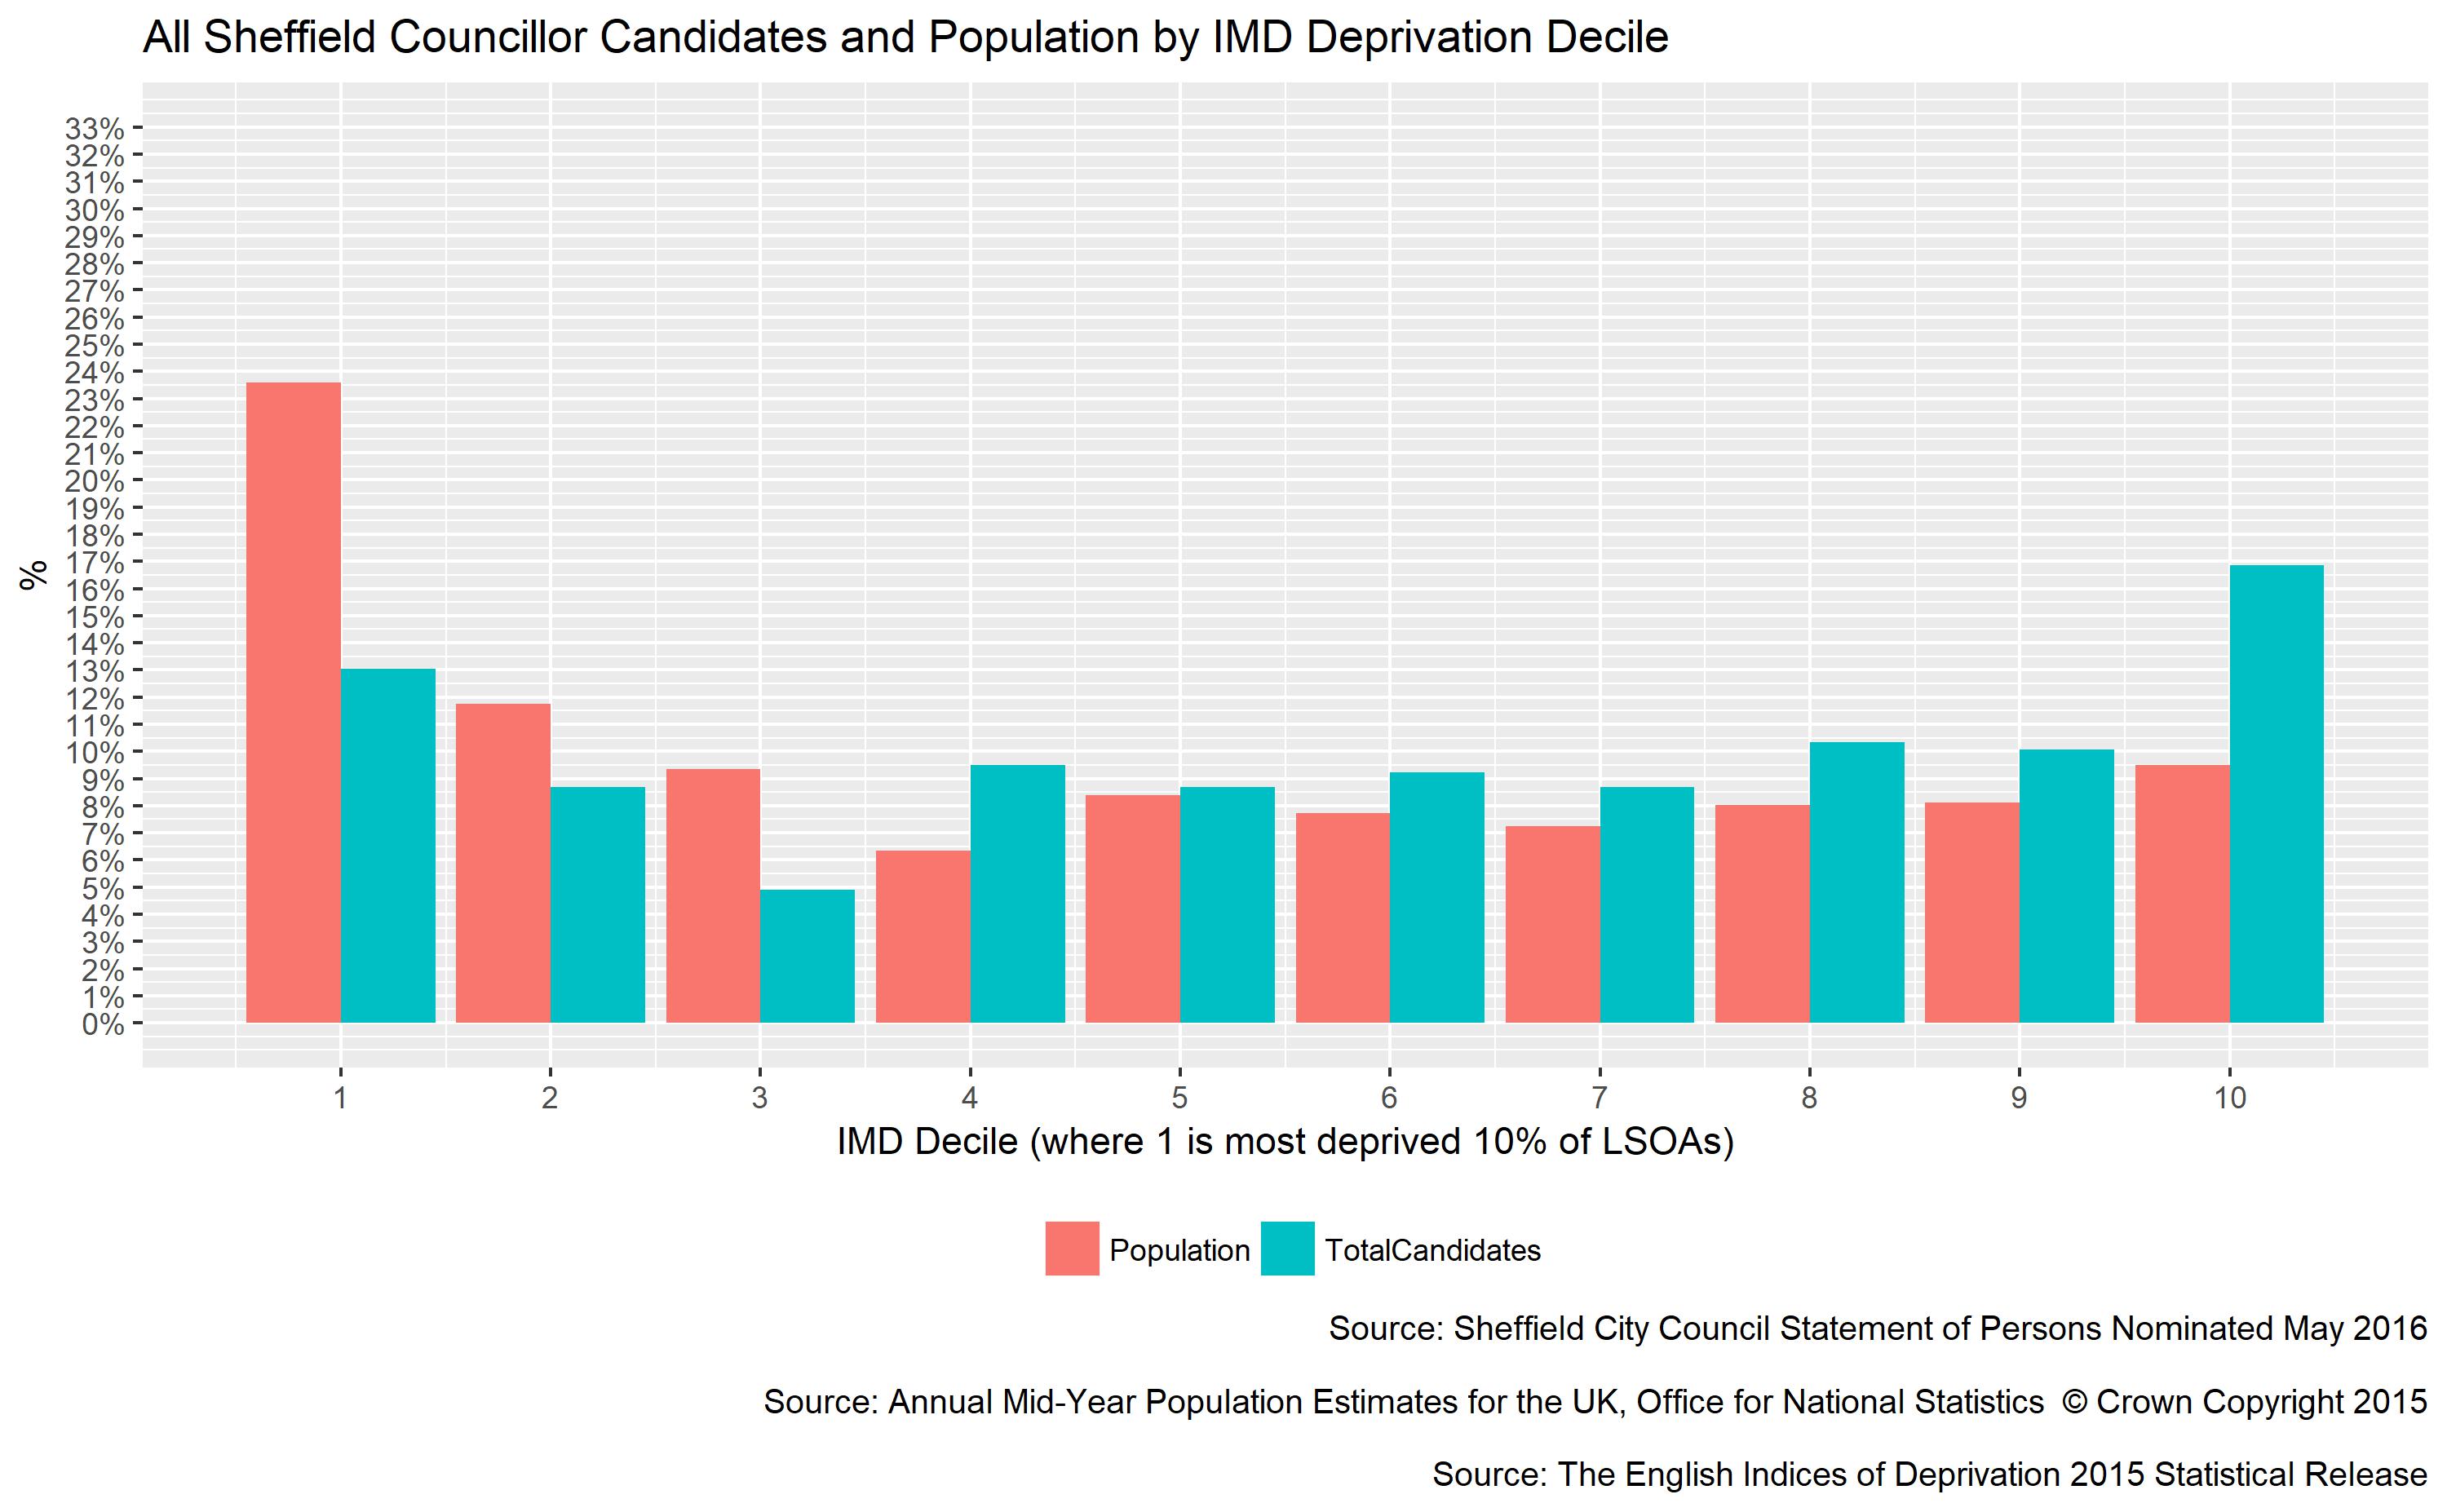
In Sheffield, 23% of people live in the most 10% deprived areas in the country, but only 13% of councillor candidates came from those areas.

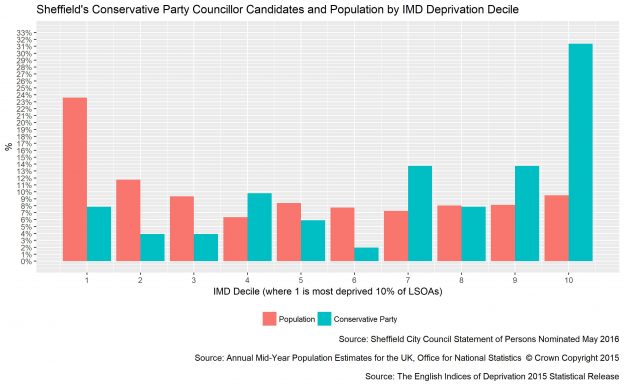
In Sheffield 9% of people live in the least 10% deprived areas in the country, but 27% of Lib Dem candidates, and 31% of Conservative party candidates came from those areas.

The full data is presented in the charts below. The data is from the 2015 Indices of Multiple Deprivation, the Sheffield City Council Statement of Persons Nominated May 2016, and Annual Mid-Year Population Estimates for the UK, for more information see my other blog post.

Sheffield candidates for May 2016 election – By deprivation level
Categories
elections

How many of Sheffield’s councillor candidates live in the ward in which they’re standing?

If you’re one of the 21,000 people who live in Firth Park Ward, then in the May 2016 Sheffield Council election, 13 of the 14 candidates you could vote for lived outside your ward.

However, in a different part of the city, 71% of East Ecclesfield’s candidates lived within the ward.

Across Sheffield the picture is varied, of the 372 candidates in 28 wards, 36% lived in the ward in which they were standing, 64% did not.

In this post I’m going to look at the candidates in the 2016 Sheffield Council election and try to explore some interesting information about the people who stand for election as local councillors. I’m not making any judgements about the results of this information, but I do think it’s interesting to see the disparity across different areas of the city and between the political parties.

The data is from the ‘Sheffield City Council Statement of Persons Nominated May 2016‘, the maps were created using QGIS, maps for all wards are at the bottom of this post and in this Google Drive folder, I hope to make the source data available online soon.