
Each year Sheffield does a traffic count in September and October. It includes both a cordon count and an occupancy survey for some roads and also some off road cycle routes. A map of the count locations is here and here). This document describes how it works. The data collected is aggregated into 15 minute chunks. The data has been collected since 2001, I do not know what was collected before then.
Summaries of the data can be obtained from Sheffield Council by writing to them (I think it should be published on their website, but until that happens I’ll publish what I have here).
Looking at the count locations. They have very good coverage of people traveling into and out of the city centre, there’s much less information about areas further out.
Modal split for 2014 looks like this, for both vehicles and people (taking into account occupancy data).
| 2014 | Total Person Trips / Mode | Proportion Person Trips / Mode | Vehicles / Mode | Proportion Vehicle Trips / Mode |
| Car / Taxi | 521,782 | 56.02% | 414,878 | 71.00% |
| Bus / Coach | 159,507 | 17.12% | 14,948 | 2.56% |
| Walk | 69,049 | 7.41% | 69,049 | 11.82% |
| Light Goods Vehicle | 65,077 | 6.99% | 55,056 | 9.42% |
| Tram | 49,889 | 5.36% | 1,283 | 0.22% |
| Rail | 37,094 | 3.98% | 180 | 0.03% |
| Medium Goods Vehicle | 10,898 | 1.17% | 10,898 | 1.86% |
| Heavy Goods Vehicle | 7,258 | 0.78% | 7,258 | 1.24% |
| Pedal Cycle | 7,160 | 0.77% | 7,160 | 1.23% |
| Motor Cycle | 3,774 | 0.41% | 3,658 | 0.63% |
| 931,488 | 100.0% | 584,368 | 100.0% |
Of course, cars dominate, with 56% of all journeys being made by car. Public transport is next at 26% (bus=17%, tram=5% and train=4%). Walking has 7.4% of journeys, and cycling at 0.77% of journeys.
Because the data above have both occupancy data and vehicle count data, it’s interesting to look at how hugely efficient public transport is. Buses make up just 2.6% of the traffic, but carry 17.1% of journeys, trams make up just 0.2% of the traffic, but carry 5.36% of journeys, and trains, just 0.03% of vehicles (180 of them) but carry 3.98% of journeys.
Looking at motor traffic (cars/taxis), they make up 71% of the vehicles, but just 56% of journeys were made by car, very inefficient.
Car/taxi occupancy has been slowly declining over the past decade, but there has been a more substantial drop from 2012 to 2013. Car/taxi occupancy in 2014 was just 1.25 people per car/taxi.

The number of person trips being counted each year has been steadily declining. A drop of 10.3% from 2001 to 2014, from 1,038,366 to 931,488 in 2014.

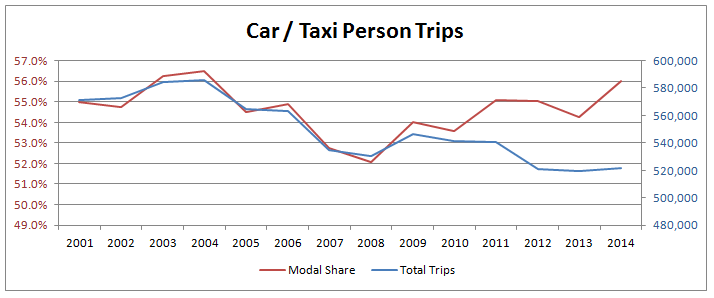
The modal share has been changing too. For cars/taxis the number of person trips has been declining (blue), but the modal share (red) has remained reasonably steady (albeit with a drop to 52% in 2008.
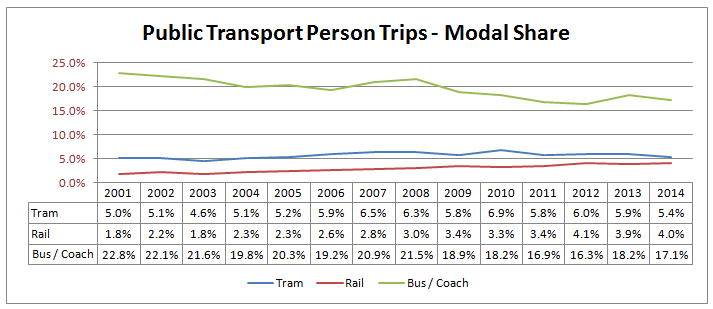
For public transport (rail, tram and bus), the number of trips was fairly steady until 2008, and then has declined consistently since. From about 31% modal share to 26.5%.

Splitting this down into each of the three modes makes clear what’s going on.
Tram modal share has been fairly steady, but down in the past couple of years (the reason could be significant tram track maintenance).
Rail has seen a significant increase both in modal share and absolute numbers of trips, from 1.8% to 4.0%, and 18,823 to 37,094 from 2001 to 2014 respectively.
But buses have seen a significant drop. From 22.8% in 2001 to 17.1% in 2014, the absolute number is revealing, 236,909 trips to 159,507 trips from 2001 to 2011. A drop of 32.7%, there are now a third fewer journeys made by bus, in just 13 years.
If total trip numbers start to increase (post recession), unless this downward trend in bus patronage is reversed then we’ll see a huge growth in private car traffic on our streets and that will be very problematic.
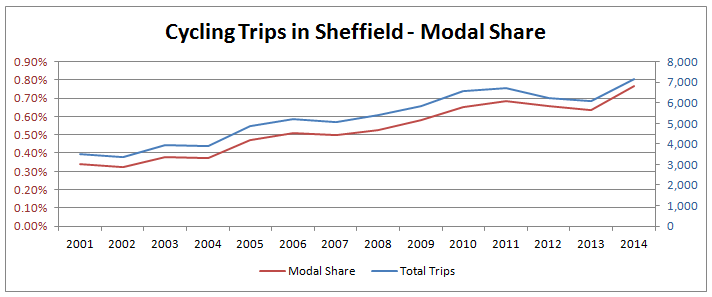
Onto cycling. In 2014, 1.21% of vehicles, and 0.77% of person trips counted we cycles, just 7,160 in total. Cycling is second to bottom in modal share, only motorcycles have fewer journeys.
Since 2001, levels have increased from 3,250 to 7,160, 0.34% modal share to 0.77% modal share.
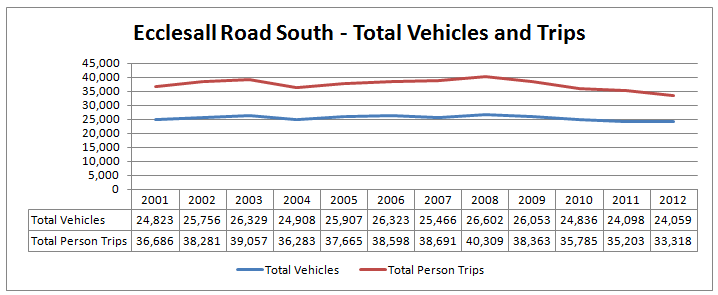
Ecclesall Road South
Further to this summary published data, the council hold detailed 15 minute data for each site. I’ve tried to request it’s release in the past via FOI, but I’ve been unsuccessful, apart from receiving one sites data for one year. Ecclesall Road South, 2012.
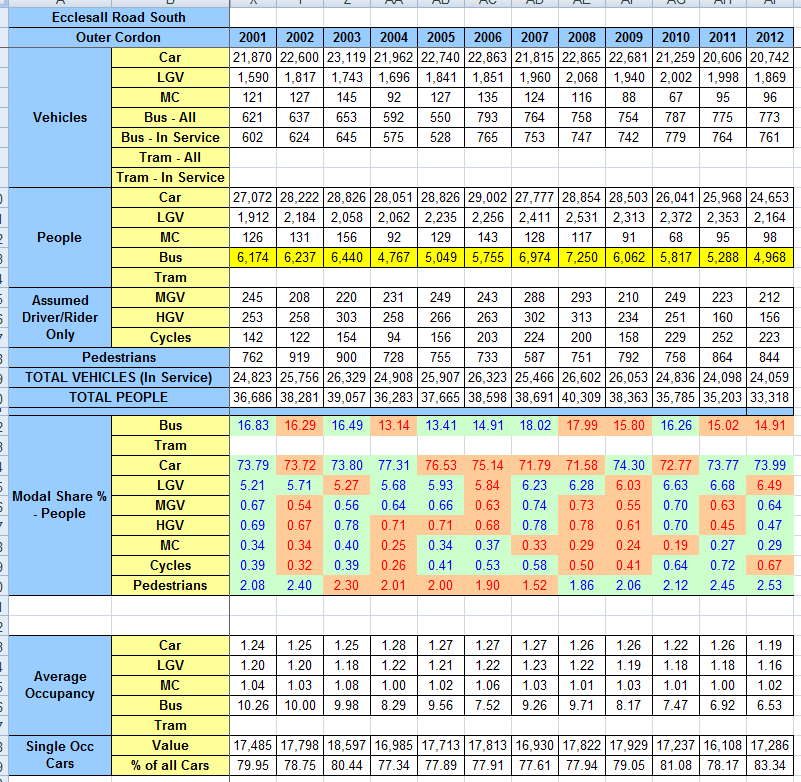
Across the whole day, for Ecclesall Road South, the number of people traveling along this road has fallen from 36,686 to 33,318. The number of vehicles has broadly remained constant.
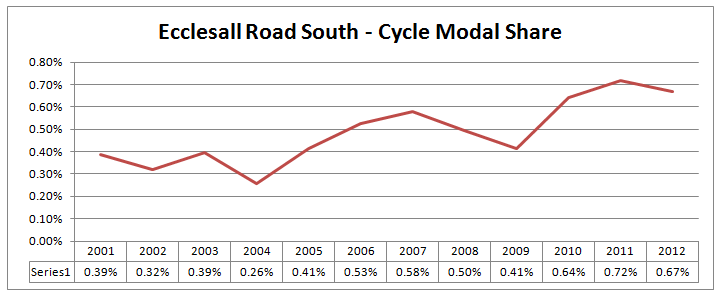
Cycling levels have increased from 142 per day in 2001 to 223 per day in 2012 (0.67% modal share). Cars down from 27,072 person trips to 24,653. The number of single occupancy cars has increased from 79.95% to 83.34%. People walking, up from 762 to 844. Public transport (bus only) person trips down from 6174 people to 4968, but an increase in bus vehicles from 621 to 773. The data is below.
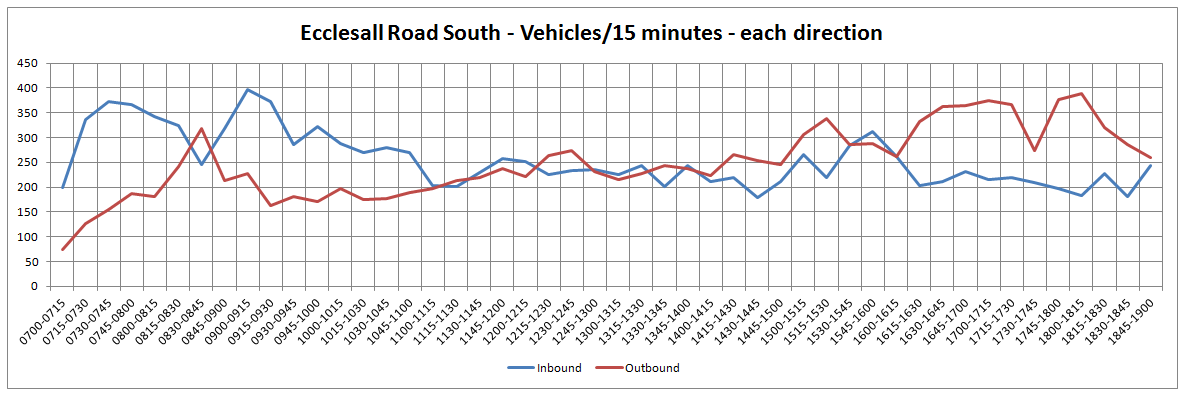
We also have detailed data for one day in 2012, broken down by direction. There were between 200 and 400 vehicles per 15 minutes across the whole day in each direction.
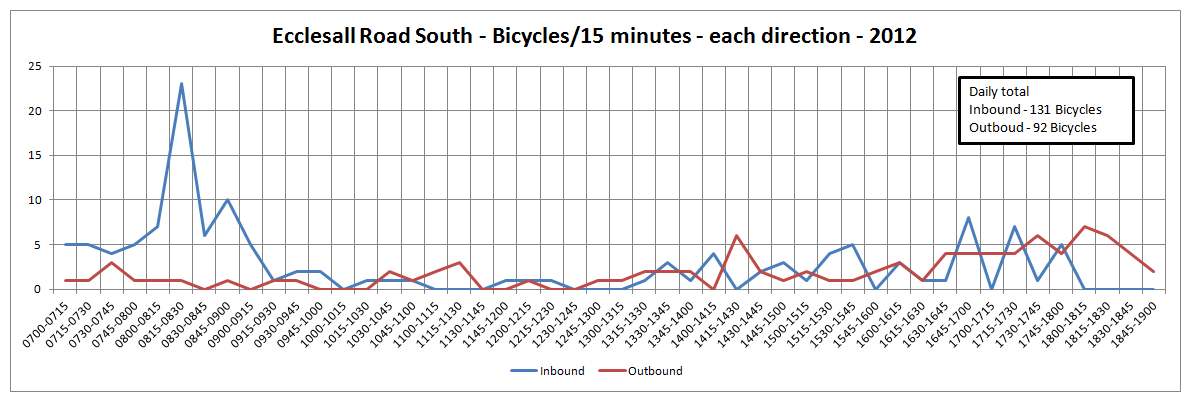
And for just bicycles, there were just 223 across the whole day, 131 inbound and 92 outbound. At a maximum rate of 23 between 08:15 to 08:30 (a modal share of about 3.7% in that 15 minute period). The modal share for the majority of the day is under 0.5%.
We can also break down the number of cars by occupancy. 1 occupant = 83.3%, 2 occupant = 14.8%, 3 occupant = 1.6%, 4 occupant = 0.03% (just 60 out of 20,742 cars).
That’s it, a whistle stop tour of traffic count data available in Sheffield. 2015 counts were done very recently (although I understand that they were late). I’ll do another post when I get a copy of the data.
1 reply on “Sheffield’s Annual Traffic Count – A look at the data”
Any joy getting data for 2015 or early 2016?