In this post I’m going to look at levels of cycling in Tonbridge.
I grew up in Tonbridge, moved to Sheffield when I was younger, and now I’m back in Tonbridge. Things in a small town of 40k people work a little differently to things in a city of half a million!
Getting to work (census 2011)
Of the approximately 17k people who travel to work each day (it’s that low, of the approx 40k people, 27k people are aged 16-74 and of those only about 20k are ‘economically active’).
Driving = 56% (9850 people), Car Passenger = 5%, Train = 20%, Walk = 14%, Bus = 2%, Cycling = 2% (365 people).
Some of the people who get the train to work will cycle to the train station and that isn’t included above, likewise for people driving to the train station.
Across Tonbridge there isn’t much variation. There are no high pockets of people cycling to work.

Breaking it down by distance
For the 5,300 people (31%) who work within Tonbridge itself, the distribution of travel to work mode is:
Driving = 46% (2467 people), Car Passenger = 6%, Train = 1%, Walk = 36%, Bus = 3%, Cycling = 5% (260 people).
And in Tonbridge, 1897 people work very close to where they live (the same MSOA), the distribution of travel to work mode is:
Driving = 31% (590 people), Car Passenger = 3%, Train = 2%, Walk = 59%, Bus = 1%, Cycling = 4% (68 people).
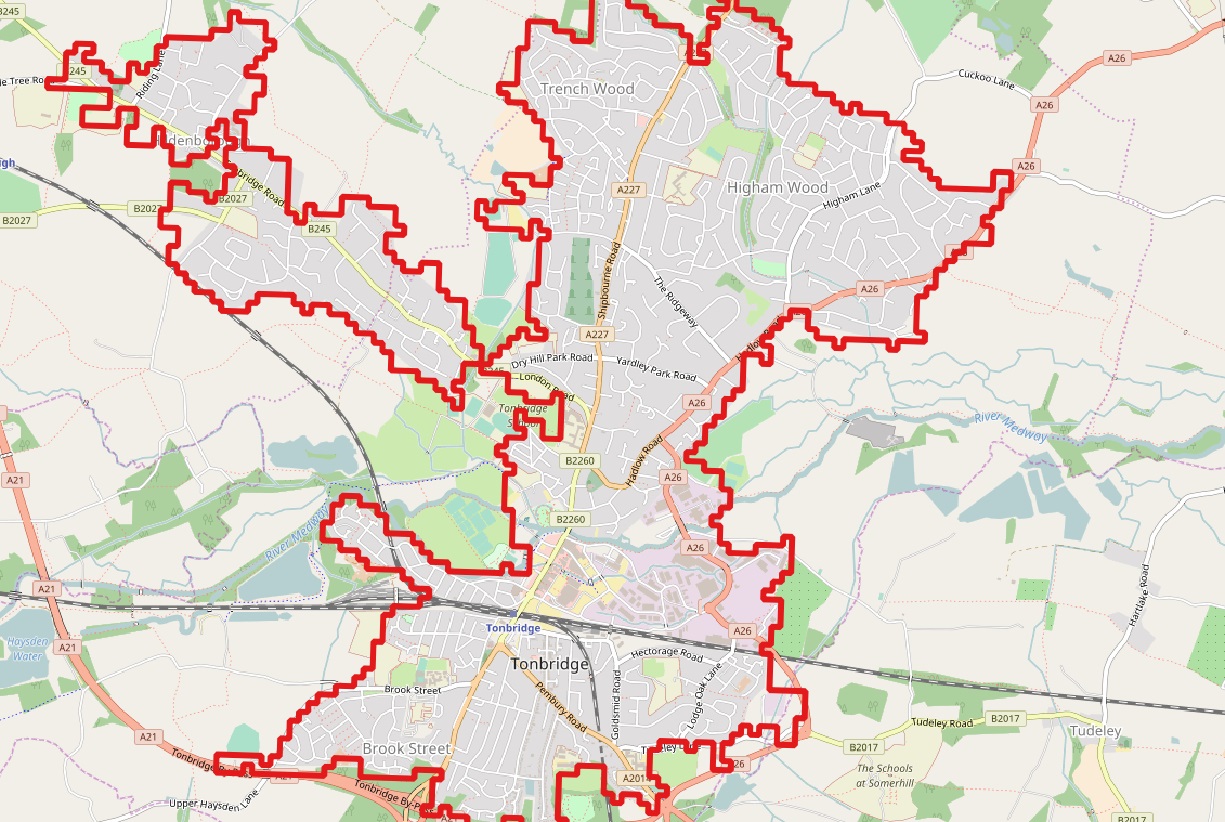
To put this into perspective, Tonbridge is divided into 5 MSOA areas, most intra MSOA journeys will be less than 1km, but 31% of them are still driven and only 4% are cycled.
| Modal Share | All Journeys | Journeys within Tonbridge | Journeys in same MSOA |
| Driving | 56% | 46% | 31% |
| Car Passenger | 5% | 6% | 3% |
| Train | 20% | 1% | 2% |
| Walk | 14% | 36% | 59% |
| Bus | 2% | 3% | 1% |
| Cycling | 2% | 5% | 4% |
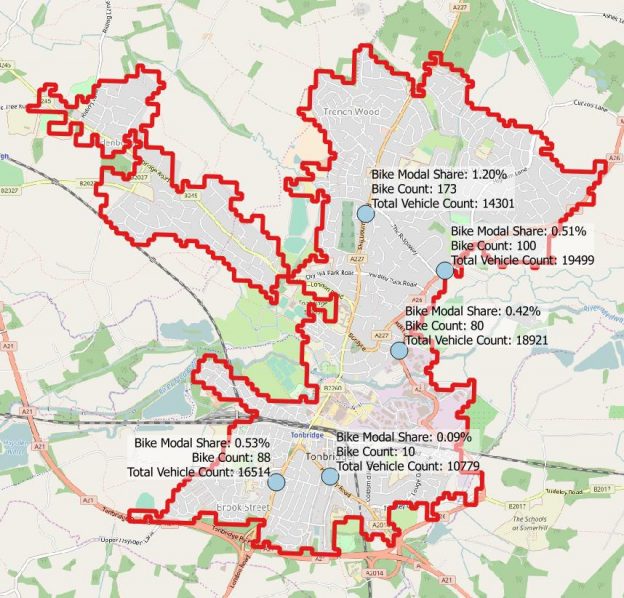
Traffic Counts
There are 5 Department for Transport traffic count points on key routes around Tonbridge.
The Estimated Annual average daily flows data shows just 451 bikes counted in 2015.
3 have a modal share of about 0.5%, 1 at 1.2% and 1 at 0.09%.

How often do people cycle?
The Active People Survey has data on cycling participation for Tonbridge and Malling Borough (which is significantly bigger than just Tonbridge).
It shows that in Tonbridge and Malling, only 2.9% of people cycle at least once per week for utility journeys, rising to 4.8% at least once per month.
| Utility Cycling | Tonbridge and Malling | Kent | South East |
| At least once per month 2014/15 | 4.8% | 3.8% | 7.5% |
| At least once per week 2014/15 | 2.9% | 2.4% | 5.2% |
| At least three times per week 2014/15 | 2.1% | 1.2% | 2.8% |
| At least five times per week 2014/15 | 0.6% | 0.6% | 1.6% |
| All Cycling | Tonbridge and Malling | Kent | South East |
| At least once per month 2014/15 | 15.1% | 13.5% | 16.8% |
| At least once per week 2014/15 | 8.3% | 7.9% | 10.6% |
| At least three times per week 2014/15 | 3.8% | 3.0% | 4.9% |
| At least five times per week 2014/15 | 2.6% | 1.8% | 2.8% |
Travel to School
Kent’s 2016 bid for the ‘Access Fund for Sustainable Travel’ included journey to school modal share. The data is from surveys that school fill in. It shows a 3.1% cycling modal share, which has been fairly constant from 2013 to 2016, about 40% by car, and just under 50% by foot.
| mode | 2013 | 2014 | 2015 | 2016 |
| 82 surveys | 173 surveys | 160 surveys | 99 surveys | |
| other | 1.3% | 1.1% | 1.5% | 0.3% |
| car share | 3.7% | 4.4% | 4.0% | 3.5% |
| car (alone) | 42.6% | 41.9% | 40.9% | 35.1% |
| rail | 0.1% | 0.1% | 0.1% | 0.2% |
| public bus | 1.2% | |||
| school bus | 0.7% | |||
| bus (all types) | 1.4% | 2.4% | 1.5% | |
| cycle | 3.2% | 3.2% | 3.3% | 3.1% |
| scoot/skate | 4.2% | |||
| park & walk | 11.8% | |||
| walk | 47.7% | 46.9% | 48.7% | 39.9% |
Next
In the next blog post, I’m going to take a look at the streets of Tonbridge and see how cycle friendly they are. With these cycling rates, the results probably won’t be surprising.